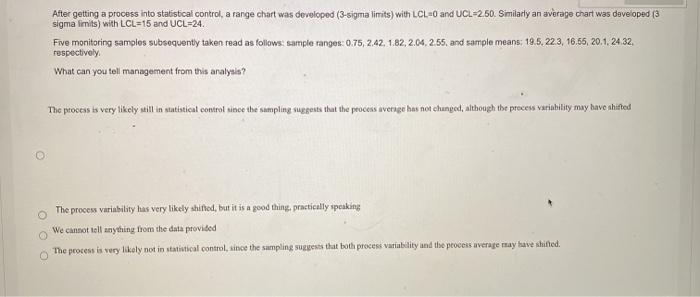
Question: After getting a process into statistical control, a range chart was developed (3-sigma limits) with LCLEO and UCL=250. Similarly an average chart was developed (3

After getting a process into statistical control,
After getting a process into statistical control, a range chart was developed (3-sigma limits) with LCLEO and UCL=250. Similarly an average chart was developed (3 sigma limits) with LCL=15 and UCL=24. Five monitoring samples subsequently taken read as follows sample ranges: 0.75, 2.42 1.82,2.04.255, and sample means: 19.5.223,16.55, 20.1. 24.32. respectively What can you tell management from this analysis? The process is very likely ill in statistical control since the sampling wrests that the process average has not changed, although the process variability may have shifted The process variability has very likely shifted, but it is a good thing practically speaking We cannot tell anything from the data provided The process is very likely not in statistical control, since the sampling see that both process variability and the process average may have shifted

Step by Step Solution

There are 3 Steps involved in it

1 Expert Approved Answer
Step: 1 Unlock blur-text-image
Question Has Been Solved by an Expert!

Get step-by-step solutions from verified subject matter experts

Step: 2 Unlock
Step: 3 Unlock

Students Have Also Explored These Related General Management Questions!