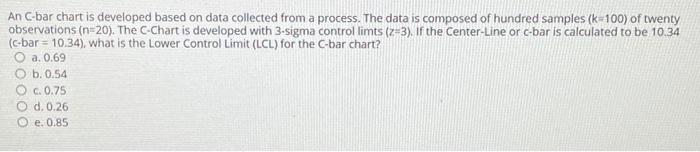
Question: An C-bar chart is developed based on data collected from a process. The data is composed of hundred samples (k-100) of twenty observations (n=20). The

An C-bar chart is developed based on data
An C-bar chart is developed based on data collected from a process. The data is composed of hundred samples (k-100) of twenty observations (n=20). The C-Chart is developed with 3-sigma control limts (2-3). If the Center-Line or c-bar is calculated to be 10.34 (c-bar = 10,34), what is the lower Control Limit (LCL) for the C-bar chart? O a. 0.69 O b. 0.54 O c.0.75 O d. 0.26 e. 0.85 Rebys Enterprises sells no-spill honey in bottles. Management is evaluating four different machines with standard deviations of 0.2, 0.16, 0.19, and 0.13 ounces for Machines A, B, C and D, respectively. The specification limits 16.85 and 17.85 ounces. Which machines should receive more detailed evaluation, le, which are statistically capable?" O a. A and B O bA and C O c. Band D O d. Cand D e. B and

Step by Step Solution

There are 3 Steps involved in it

1 Expert Approved Answer
Step: 1 Unlock blur-text-image
Question Has Been Solved by an Expert!

Get step-by-step solutions from verified subject matter experts

Step: 2 Unlock
Step: 3 Unlock

Students Have Also Explored These Related General Management Questions!