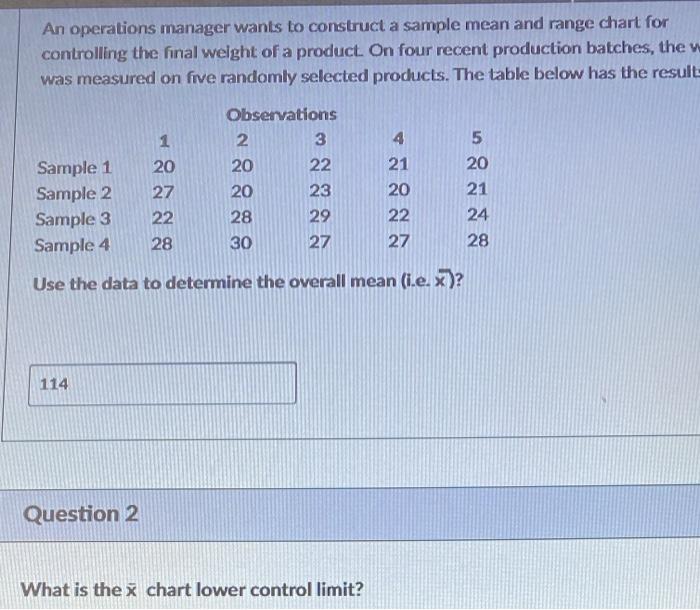
Question: An operations manager wants to construct a sample mean and range chart for controlling the final weight of a product. On four recent production batches,

An operations manager wants to construct a sample
An operations manager wants to construct a sample mean and range chart for controlling the final weight of a product. On four recent production batches, the was measured on five randomly selected products. The table below has the result 4 Sample 1 Sample 2 Sample 3 Sample 4 1 20 27 22 28 Observations 2 3 20 22 20 23 28 29 27 21 20 22 27 5 20 21 24 28 30 Use the data to determine the overall mean (i.e. x)? 114 Question 2 What is the x chart lower control limit? What is the & chart lower control limit? Question 3 What is the x chart upper control limit? 2 pts Question 4 What is the range chart's lower control limit? 2 pts

Step by Step Solution

There are 3 Steps involved in it

1 Expert Approved Answer
Step: 1 Unlock blur-text-image
Question Has Been Solved by an Expert!

Get step-by-step solutions from verified subject matter experts

Step: 2 Unlock
Step: 3 Unlock

Students Have Also Explored These Related General Management Questions!