

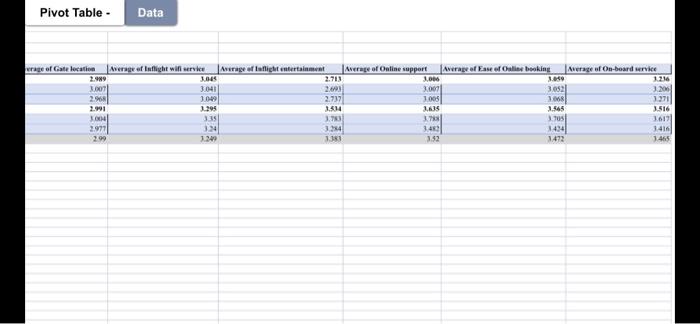
Question: analyze the data and interpret the results, write around 1000 words about the customer satisfaction in general and its importance, beside add comments and build
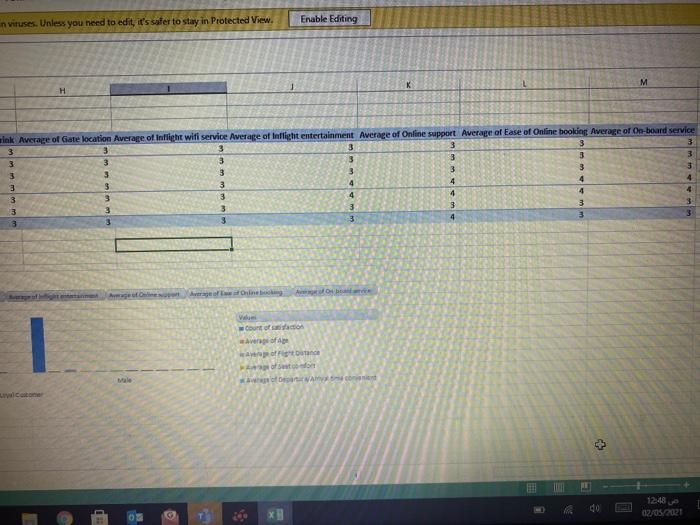
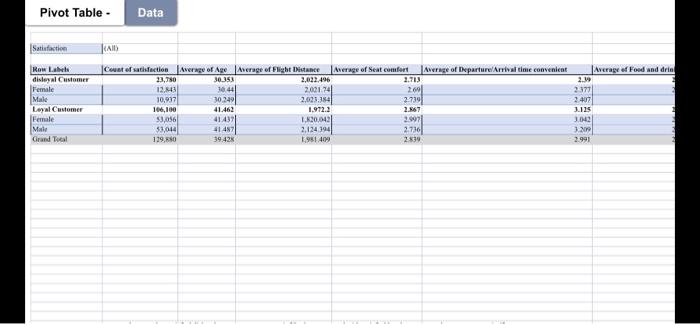
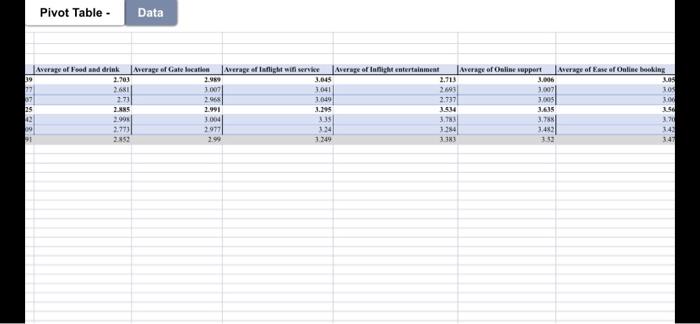
analyze the data and interpret the results, write around 1000 words about the customer satisfaction in general and its importance, beside add comments and build predictions based on this pivot table 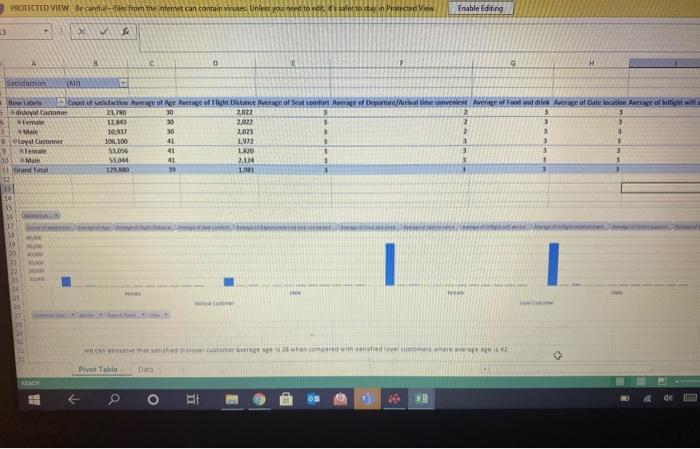
Step by Step Solution
There are 3 Steps involved in it
1 Expert Approved Answer
Step: 1 Unlock

Question Has Been Solved by an Expert!
Get step-by-step solutions from verified subject matter experts
Step: 2 Unlock
Step: 3 Unlock