

Question: Analyzing Financial Risk Presented below are selected financial data from the The Coca-Cola Company 2018 annual report. Using the ratio definitions from Exhibit 4.6, calculate
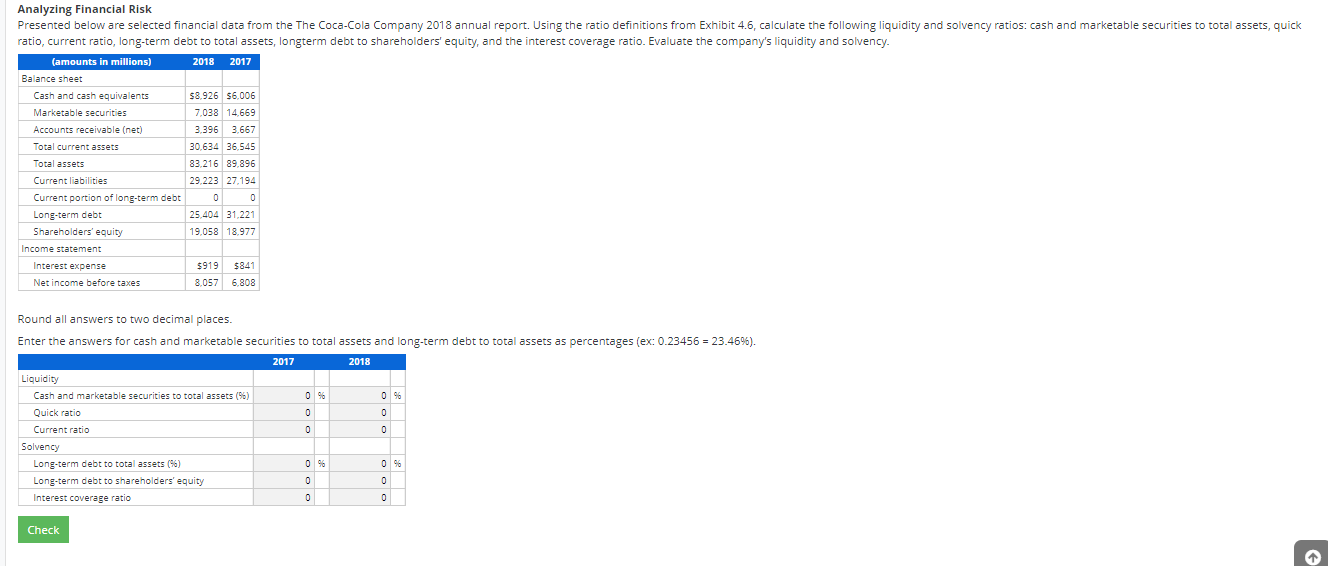
Analyzing Financial Risk Presented below are selected financial data from the The Coca-Cola Company 2018 annual report. Using the ratio definitions from Exhibit 4.6, calculate the following liquidity and solvency ratios: cash and marketable securities to total assets, quick ratio, current ratio, long-term debt to total assets, longterm debt to shareholders' equity, and the interest coverage ratio. Evaluate the company's liquidity and solvency. (amounts in millions) 2018 2017 Balance sheet Cash and cash equivalents $8.926 $6,006 Marketable securities 7,038 14.669 Accounts receivable (net) 3.396 3.667 Total current assets 30,634 36.545 Total assets 83,216 89.896 Current liabilities 29,223 27.194 Current portion of long-term debt 0 0 Long-term debt 25,404 31221 Shareholders' equity 19.058 18.977 Income statement Interest expense Net income before taxes $919 $841 8.057 6.808 Round all answers to two decimal places. Enter the answers for cash and marketable securities to total assets and long-term debt to total assets as percentages (ex: 0.23456 = 23.46%). 2017 2018 0 0 0 0 Liquidity Cash and marketable securities to total assets (9) Quick ratio Current ratio Solvency Long-term debt to total assets (96) Long-term debt to shareholders' equity Interest coverage ratio 0 % 0 0 0 0 Check
Step by Step Solution
There are 3 Steps involved in it

Get step-by-step solutions from verified subject matter experts