

Question: Answer all the question including how we would classify the variable please!! INSTRUCTIONS You will need to use R to answer this question. You must
Answer all the question including how we would classify the variable please!! INSTRUCTIONS
You will need to use to answer this question.
You must submit a single pdf file containing your complete solutions including the code and output.
Solutions need not be typed although they can be but handwritten solutions will need to be scanned
to a pdf file which must be readable.
Question
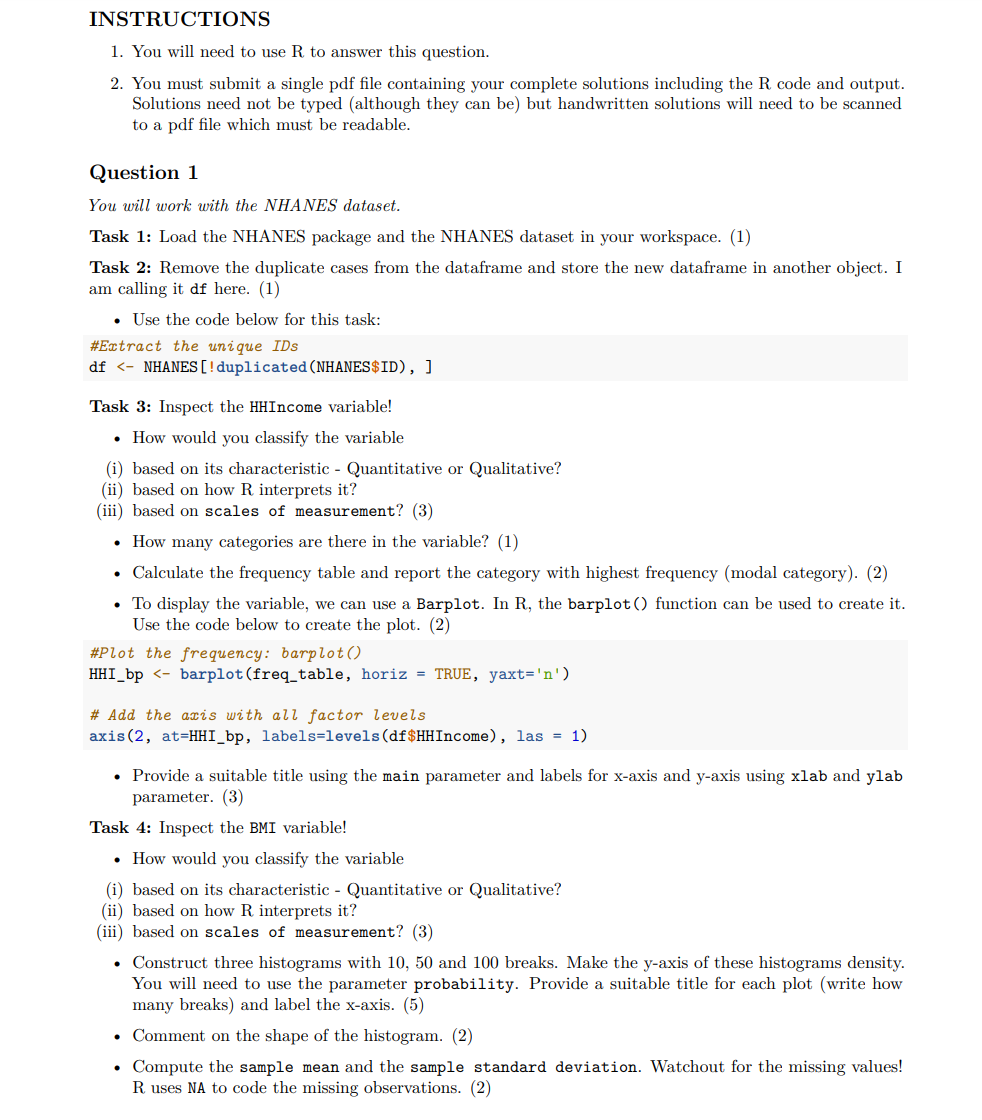
You will work with the NHANES dataset.
Task : Load the NHANES package and the NHANES dataset in your workspace.
Task : Remove the duplicate cases from the dataframe and store the new dataframe in another object. I
am calling it df here.
Use the code below for this task:
#Extract the unique IDs
df NHANESduplicatedNHANES$ID
Task : Inspect the HHIncome variable!
How would you classify the variable
i based on its characteristic Quantitative or Qualitative?
ii based on how interprets it
iii based on scales of measurement?
How many categories are there in the variable?
Calculate the frequency table and report the category with highest frequency modal category
To display the variable, we can use a Barplot. In R the barplot function can be used to create it
Use the code below to create the plot. HHIbp barplotfreqtable, horiz TRUE, yaxtnaxis atHHIbp labelslevelsdf$HHIncome las Provide a suitable title using the main parameter and labels for xaxis and yaxis using xlab and ylab
parameter.
Task : Inspect the BMI variable!
How would you classify the variable
i based on its characteristic Quantitative or Qualitative?
ii based on how interprets it
iii based on scales of measurement?
Construct three histograms with and breaks. Make the yaxis of these histograms density.
You will need to use the parameter probability. Provide a suitable title for each plot write how
many breaks and label the xaxis.
Comment on the shape of the histogram.
Compute the sample mean and the sample standard deviation. Watchout for the missing values!
uses NA to code the missing observations.
Step by Step Solution
There are 3 Steps involved in it
1 Expert Approved Answer
Step: 1 Unlock

Question Has Been Solved by an Expert!
Get step-by-step solutions from verified subject matter experts
Step: 2 Unlock
Step: 3 Unlock