

Question: ANSWER ASAP PLEASE Here is a graph for college pantry users for fall 2020 semester by week. Can you please analysis and interpret it? Note:
ANSWER ASAP PLEASE
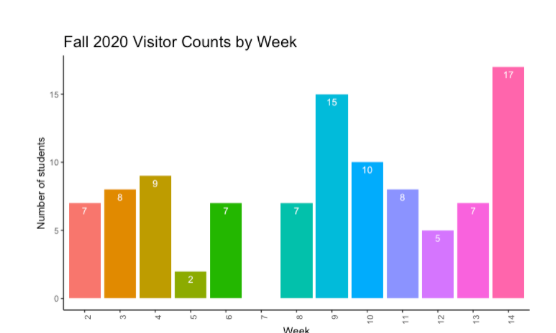
Here is a graph for college pantry users for fall 2020 semester by week. Can you please analysis and interpret it?
Note: This is a bit caveat b/c there is some slippage in the actual weeks students visited
Fall 2020 Visitor Counts by Week 17 15 students 10 Number LI 0 16 12 13 14 WeekStep by Step Solution
There are 3 Steps involved in it
1 Expert Approved Answer
Step: 1 Unlock

Question Has Been Solved by an Expert!
Get step-by-step solutions from verified subject matter experts
Step: 2 Unlock
Step: 3 Unlock