

Question: answer only need it asap QUESTION 4 Q3-MA-STP-02 Identify if the probLem statement can be solved using statistics. Where can we get the data about
answer only need it asap
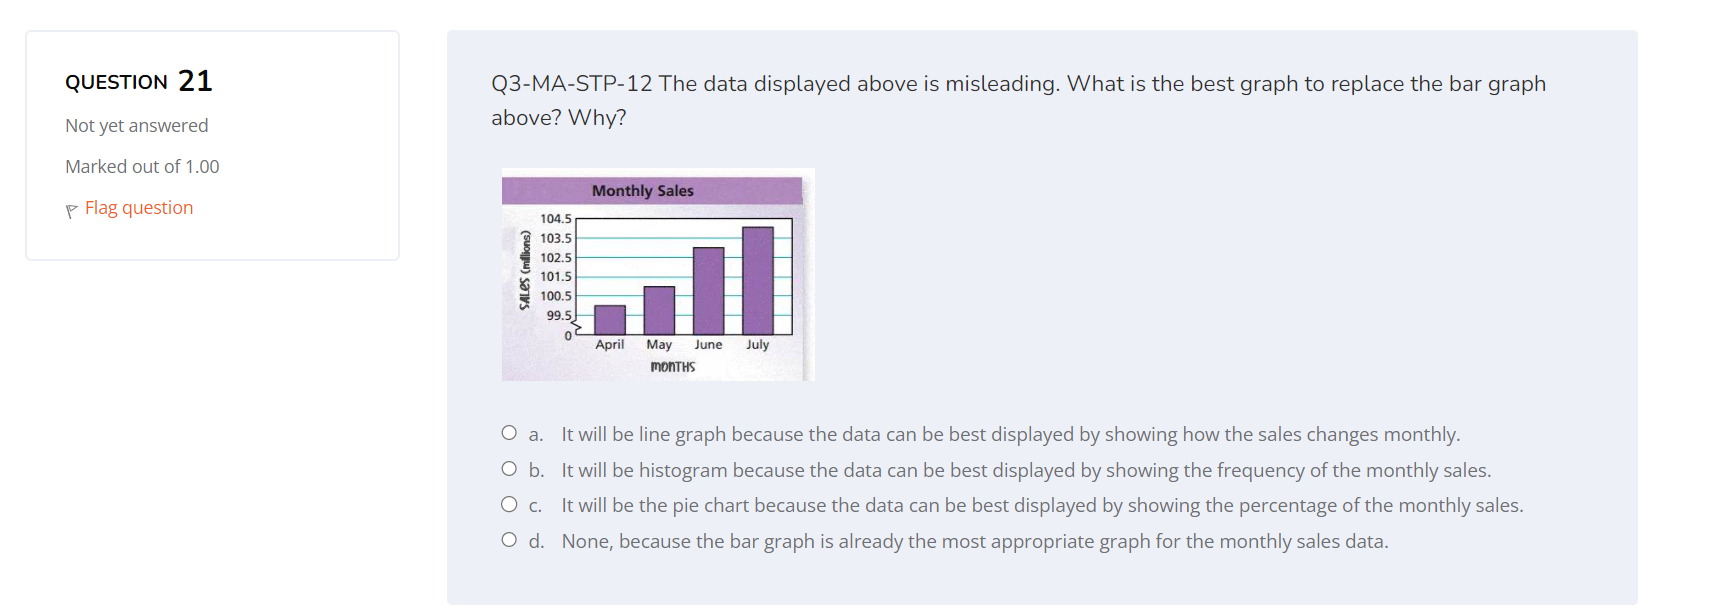
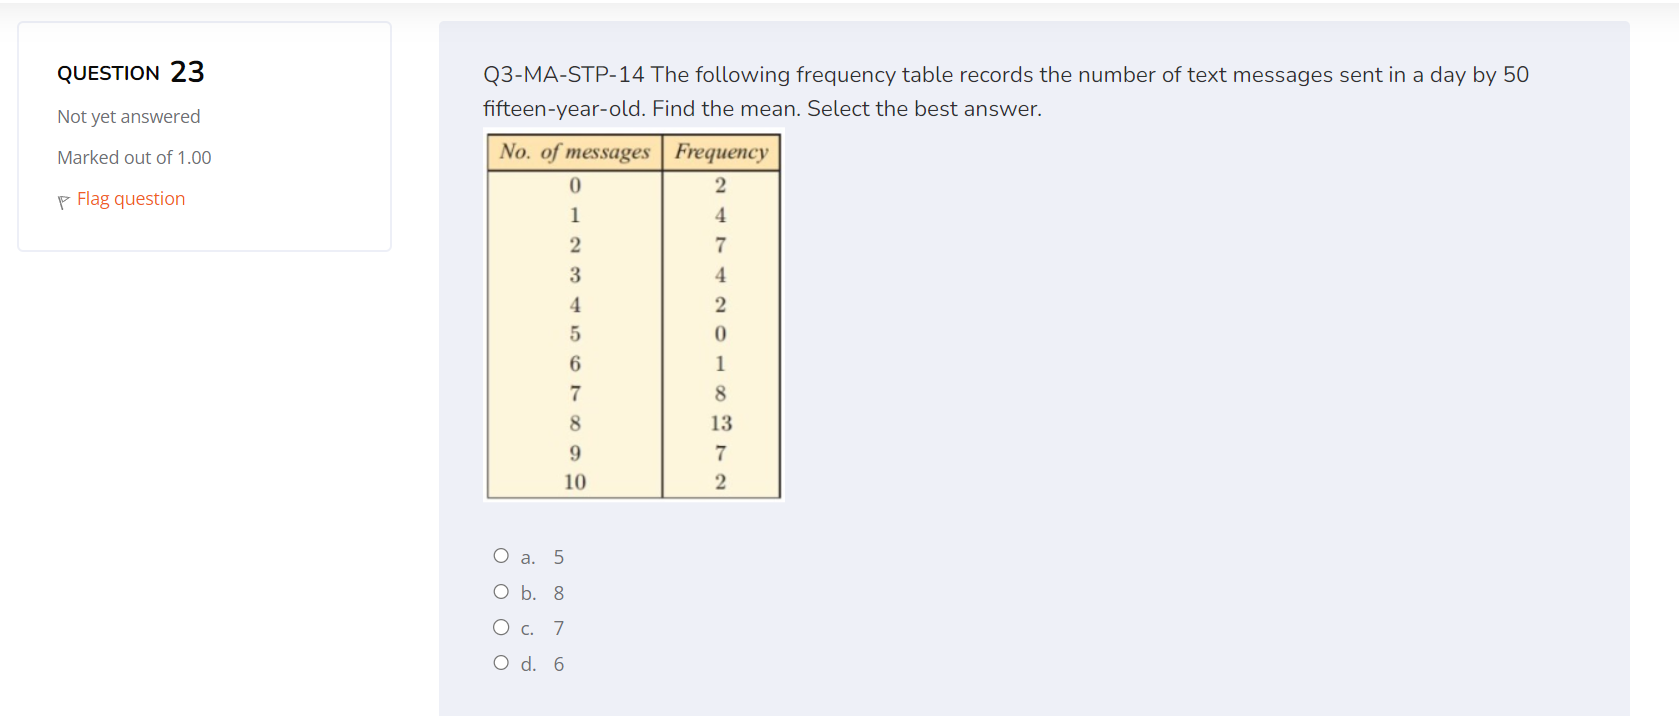
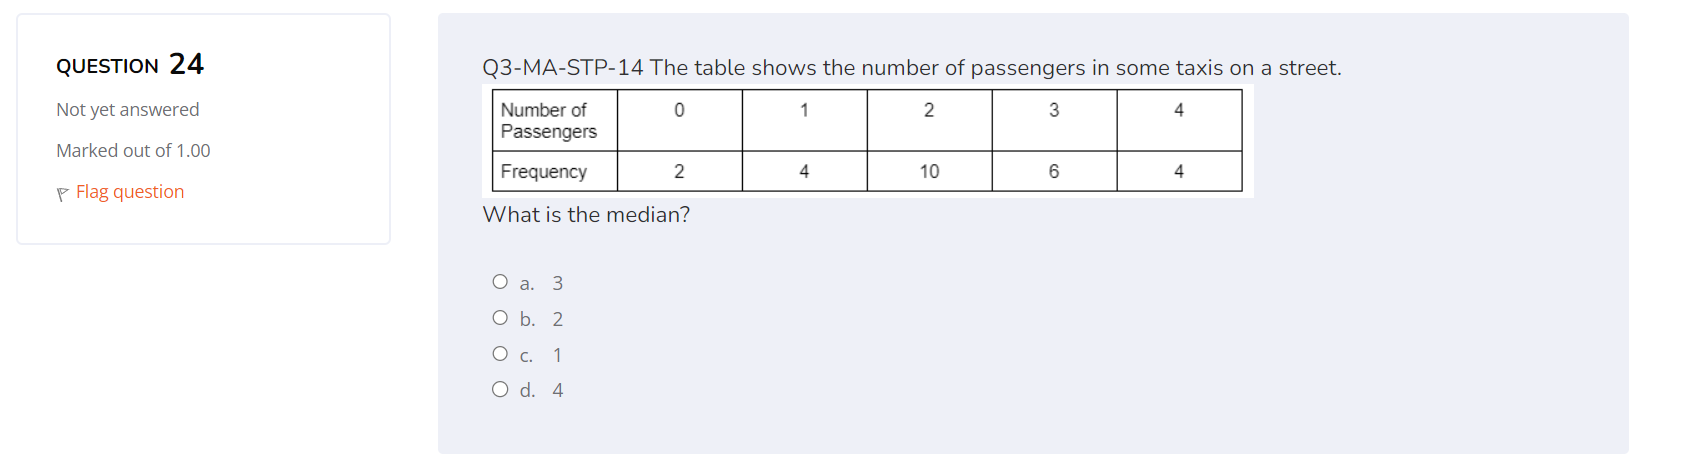
QUESTION 4 Q3-MA-STP-02 Identify if the probLem statement can be solved using statistics. "Where can we get the data about Not yet answered 'meaUun rates in the Philipplnes?\" Marked out of 1.00 O a. YES F Flag question Ob. NO QUESTION 5 Q3-MA-STP-03 Which type of statistical study best describes the following situation: "Marco measures the Not yet answered cholesterol of 15 subjects who report that they eat pork regularly and 15 subjects who report that they do Marked out of 1.00 not eat pork regularly."? P Flag question O a. Meta-analysis O b. Survey O c. Experiment O d. ObservationQUESTION 8 Q3-MA-STP-06 Identify the type of sampling method being used in the following situation. Not yet answered Lucy identied her respondents by asking people who would be most suited for her study. With this, she is referred from one respondent to the other. Marked out of 1.00 \\7 Flag question 0 a. Voluntary O b. Simple Random 0 c. Purposive 0 d. Convenience QUESTION 11 Q3-MA-STP-07 For a school project, three students need to produce a sample of students at their school. Not yet answered Which of the following methods leads to a random sample? Marked out of 1.00 O a. Calling for volunteers at the school assembly P Flag question O b. Calling for volunteers via social media platforms O c. Produce the sample from a random list of numbers of each students O d. Asking each of their friends to name three further friends Clear my choiceQUESTION 21 Q3MASTPl2 The data displayed above is misleading. What is the best graph to replace the bar graph Not yet answered above? Why? Marked out of 1.00 104.5 103.5 102.5 101.5 1N5 99.5 V Flag question Willa-u) April May June July warms O a. It will be line graph because the data can be best displayed by showing how the sales changes monthly. 0 b. It will be histogram because the data can be best displayed by showing the frequency of the monthly sales. 0 c. It will be the pie chart because the data can be best displayed by showing the percentage ofthe monthly sales. 0 d. None, because the bar graph is already the most appropriate graph for the monthly sales data. QUESTION 23 Q3MASTP 14 The foLlowing frequency table records the number of text messages sent in a day by 50 Not yetanswered fteen-year-old. Find the mean. Select the best answer. we Flag question . 5 .8 0c. 7 .6 QUESTION 24 Q3-MA-STP-14 The table shows the number of passengers in some taxis on a street. Not yet answered Number of 0 2 3 Passengers Marked out of 1.00 Frequency 2 4 10 6 4 P Flag question What is the median? O a. 3 O b. 2 O c. 1 O d. 4
Step by Step Solution
There are 3 Steps involved in it

Get step-by-step solutions from verified subject matter experts