

Question: Answer only Problem #2, Problem #1 is only for reference. Please answer questions is problem #2 or dont answer at all please very important. show
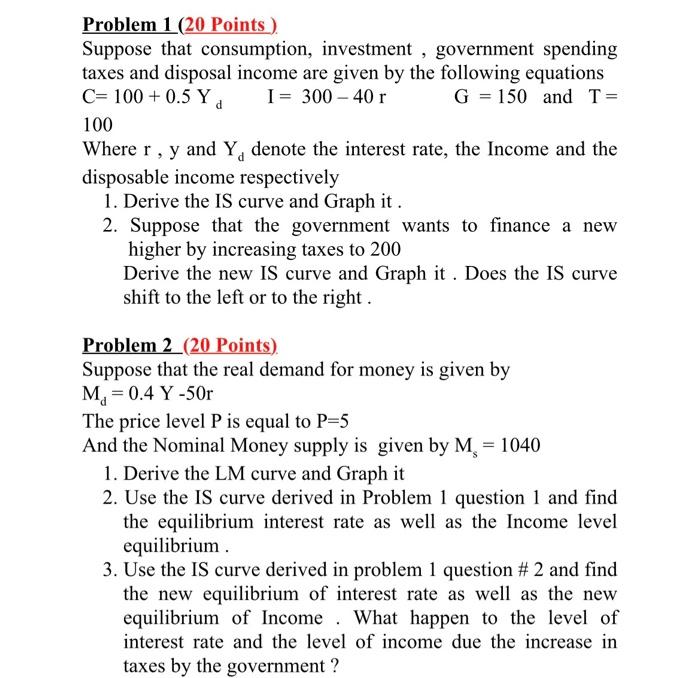
Problem 1 (20 Points). Suppose that consumption, investment, government spending taxes and disposal income are given by the following equations C=100+0.5YdI=30040rG=150 and T= 100 Where r,y and Yd denote the interest rate, the Income and the disposable income respectively 1. Derive the IS curve and Graph it . 2. Suppose that the government wants to finance a new higher by increasing taxes to 200 Derive the new IS curve and Graph it. Does the IS curve shift to the left or to the right . Problem 2 (20 Points). Suppose that the real demand for money is given by Md=0.4Y50r The price level P is equal to P=5 And the Nominal Money supply is given by Ms=1040 1. Derive the LM curve and Graph it 2. Use the IS curve derived in Problem 1 question 1 and find the equilibrium interest rate as well as the Income level equilibrium . 3. Use the IS curve derived in problem 1 question \# 2 and find the new equilibrium of interest rate as well as the new equilibrium of Income. What happen to the level of interest rate and the level of income due the increase in taxes by the government
Step by Step Solution
There are 3 Steps involved in it

Get step-by-step solutions from verified subject matter experts