

Question: answer the question, need answer only Question 49 Time lent Use the figure below to answer the following questions. Not yet answered Table 3.5.2 Marked
answer the question, need answer only
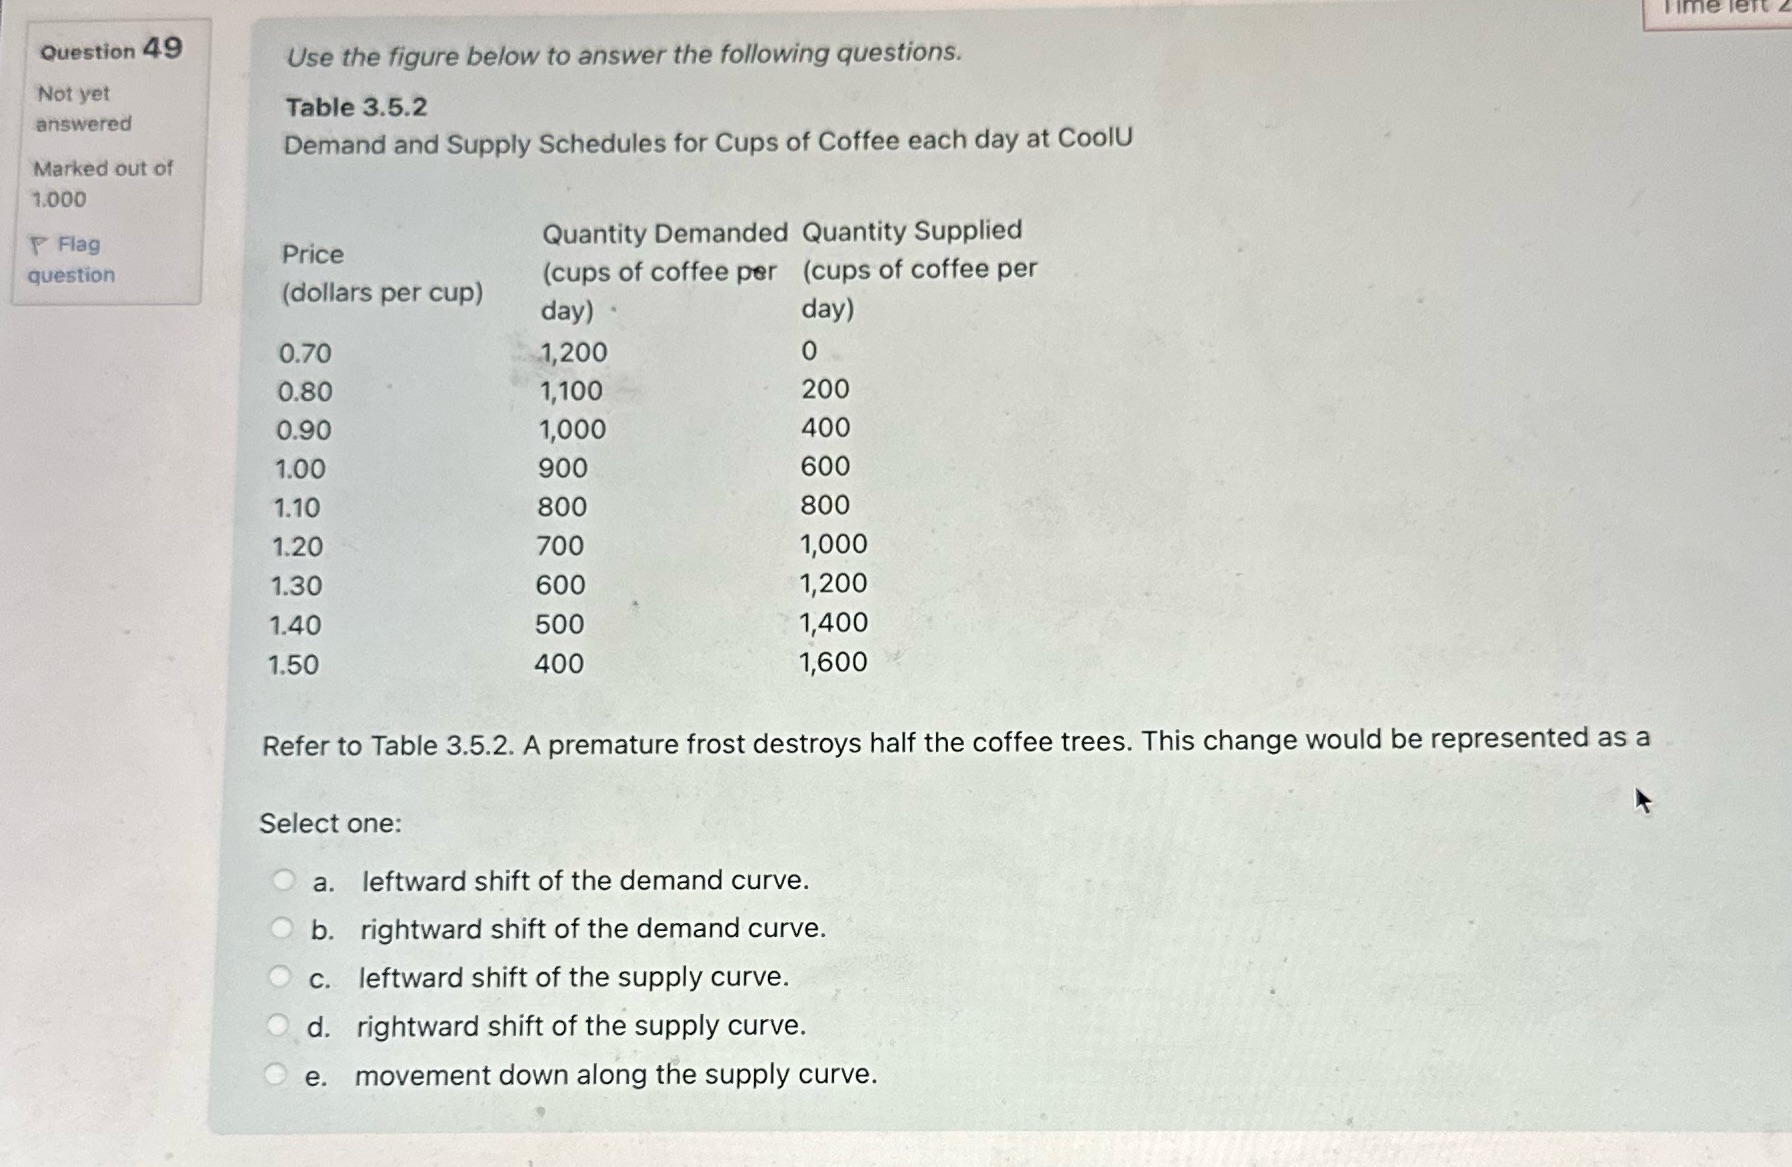
Question 49 Time lent Use the figure below to answer the following questions. Not yet answered Table 3.5.2 Marked out of Demand and Supply Schedules for Cups of Coffee each day at CoolU 1.000 P Flag Price Quantity Demanded Quantity Supplied question (dollars per cup) (cups of coffee per (cups of coffee per day) day) 0.70 1,200 0 0.80 1,100 200 0.90 1,000 400 1.00 900 600 1.10 800 800 1.20 700 1,000 1.30 600 1,200 1.40 500 1,400 1.50 400 1,600 Refer to Table 3.5.2. A premature frost destroys half the coffee trees. This change would be represented as a Select one: O a. leftward shift of the demand curve. O b. rightward shift of the demand curve. O c. leftward shift of the supply curve. O d. rightward shift of the supply curve. e. movement down along the supply curve
Step by Step Solution
There are 3 Steps involved in it

Get step-by-step solutions from verified subject matter experts