

Question: Answer the questions based on the graph shown below: Fill In The Blank: [A] The dashed line ( _ _ _ _ _ _ )
Answer the questions based on the graph shown below:
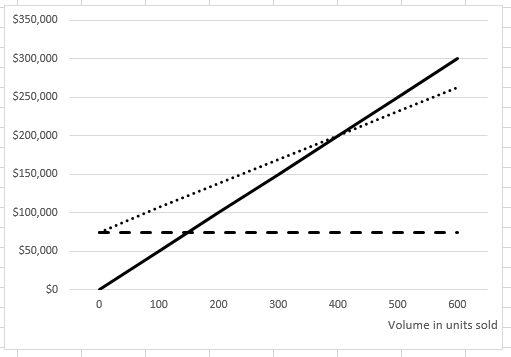
Fill In The Blank:
[A] The dashed line ( _ _ _ _ _ _ ) represents _______.
[B] The dotted line ( ......... ) represents _______.
[C] The solid line ( _______ ) represents _______.
[D] The approximate numbers of units at the break-even point is _______.
[E] In a sentence or two, describe the variable expense line. If applicable, include its relation to the other lines shown on the graph.
$350,000 $300,000 $250,000 $200,000 150,000 100,000 50,000 SO 100 200 300 400 500 600 Volume in units sold
Step by Step Solution
There are 3 Steps involved in it
1 Expert Approved Answer
Step: 1 Unlock

Question Has Been Solved by an Expert!
Get step-by-step solutions from verified subject matter experts
Step: 2 Unlock
Step: 3 Unlock