Question: Assignment 2 - Measure I Measurement stage: Deliverables: Process Data Collection Plan Use the Case Process Map and add relevant details to it. Classify each

Assignment 2 - Measure I
Measurement stage:
Deliverables:
Process Data Collection Plan
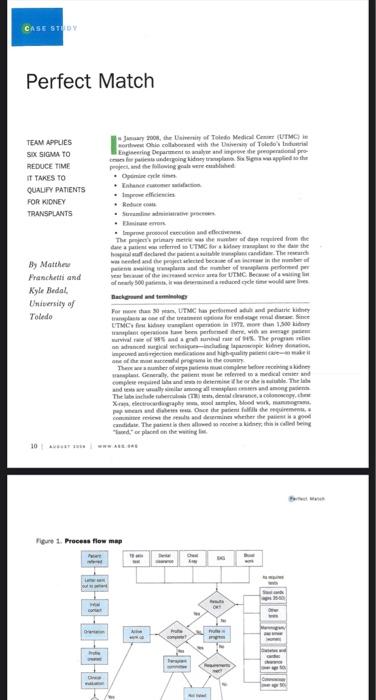
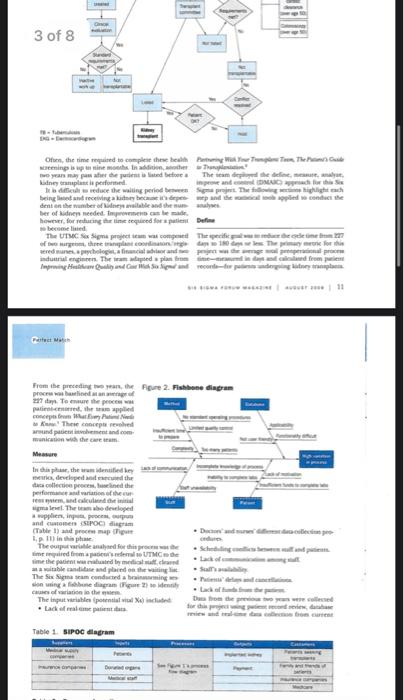
Use the Case Process Map and add relevant details to it. Classify each step you can with the type of waste and present it visually.
Assignment 2 - Measure I Measurement stage:
Assignment 3 - Measure II
Attached Files:
https://virtualcampus.pupr.edu/bbcswebdav/pid-2084013-dt-content-rid-26301902_1/xid-26301902_1
Submit Measure I and Measure II Stage corrections.
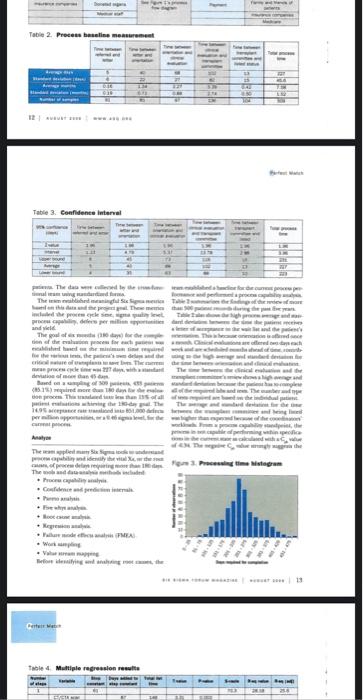
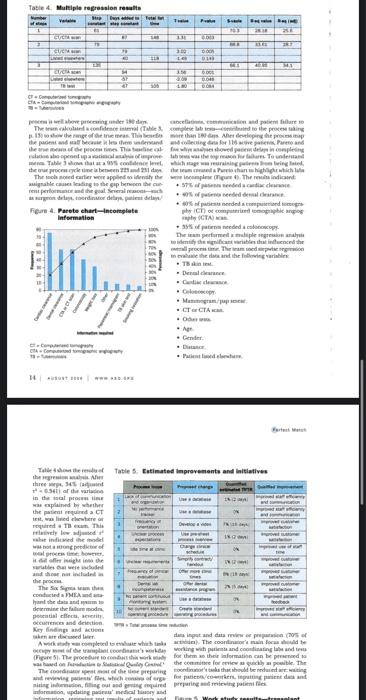
Use the Simulated Information Data Set of the Perfect Match Case to be analyzed and deliver the following graphs and explained calculations:
Descriptive Statistics
Present Graphical Analysis with Written Explanations
All of Time:
histogram
boxplot
Std.Requirements:
foot chart
Profile Completed
foot chart
Include comparative analysis with the baseline and the goal of 180 days to see how much difference there is with respect to the total time.
Deliver in Word or PDF format
Perfect Match TEMM APPLIES sa sICMA to REDUCE TIME profeci, and the Bileaing goals were euabided. It Thkes T0 - Opernire qute times QUALFY PATIENTS + Tribane rametert autitartion FOR KIDNEY - improve rffeientita TRANSPLANTS - Rebuir taat The project primary metre was the winber of dop reyuired from the By Natthest Franchetti and Ryle Bedal. Binierersity af Totedo "lued" ex plactil on the wieting las 10 Avasur azes ainer eranyplats is peiformed hewever, for reaturus the time tequised for a patient The bevere liaited Table 1 sapoct diatram Tabie 2. Precess haneline mansurament Table 3. Cenfidente interval and vield. drvichine of ment das 45 tapt. carmat poscetal. Asatyan - hemo mahin + Fise whye asalyer + llooc taon a alpik + Mreventan andipa - Vallue mode eform asalria FMYA. - Work alapplest - Yahat meati naypete Toble \& Multiple regression reselte Tatie 4. Muteiple recresaion realits mesignatie causet leating is the grp bernesen the cuer- - s al panene treded a rantiar clemeve Figure 4. Rarete chart-incomplate - TBuinired - Denal rlearane - Castik delenater - Cetutuevert - Masumegran'jugr socer - CT tertancan. a Dater awa. a Aut - Cenier. - Distanc - Tacietat laxd elerefariz the regremien malwat Nhe three meje, 34. factuant t4 in 0.34fi of the variadent in the tseal prosmet tine was explained be whethes the patient evtuirnd a CT tent, was lined rlacehere of requered a Tb exan. This irlesivefy lew actjansed 4 eshere intitaved the mosel weat prwese titit, bowerer. is the seftre ineght inco the and theer nat insluefelt an the prosese. The 5 shmea inun that concucted a MMtLM and ata hand the tase and romin its deciormine the fallure roodn. pebcatial effecta, acverity occucterice and deiertion. Mry findings and actevet taben ere diecesed leirt. intormation, updaine padrau' inedical thasey and 8 of 8 acosecer 16

Step by Step Solution

There are 3 Steps involved in it

1 Expert Approved Answer
Step: 1 Unlock blur-text-image
Question Has Been Solved by an Expert!

Get step-by-step solutions from verified subject matter experts

Step: 2 Unlock
Step: 3 Unlock

Students Have Also Explored These Related General Management Questions!