Question: Assignment 3: INTERPRETING DATA Submission date: 21 August 2024 @17h00 INSTRUCTIONS: What you need to submit: 1. Answer ALL questions in the submitted .pdf file
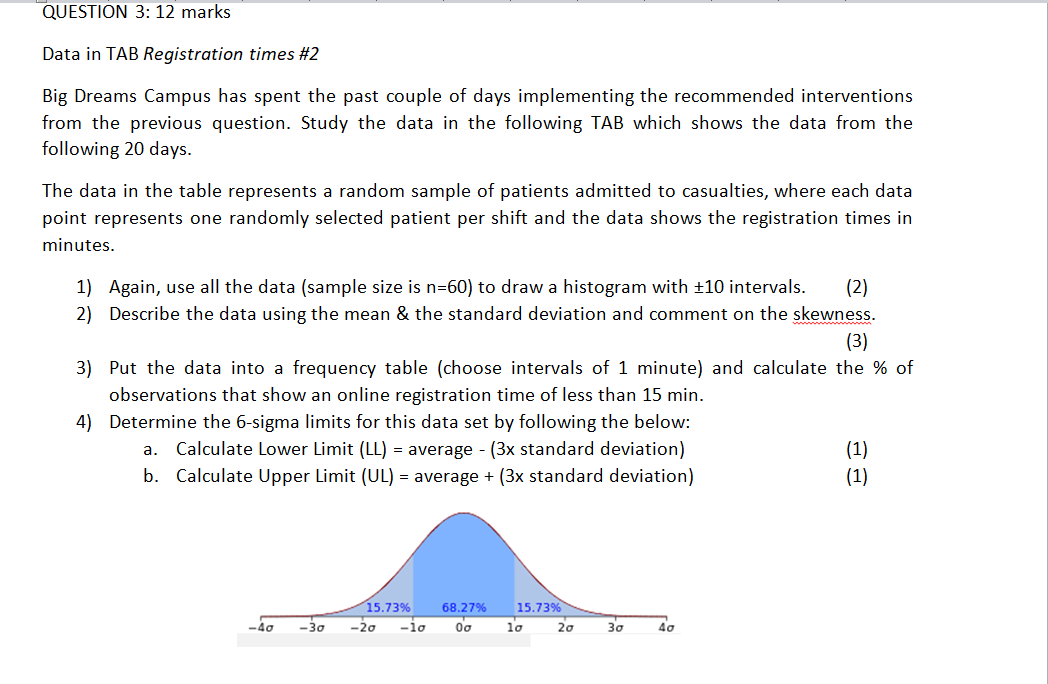
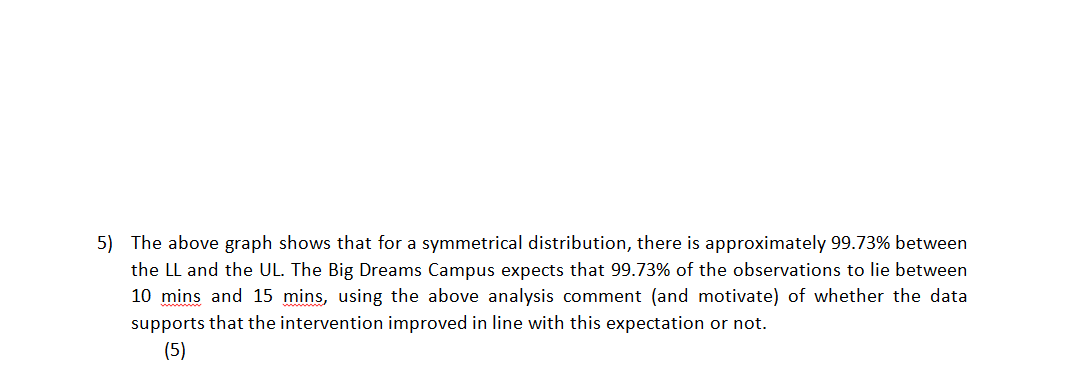
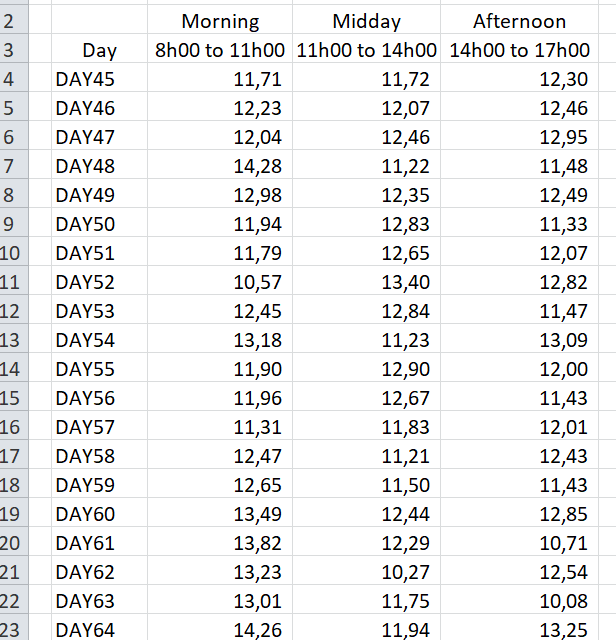
Assignment 3: INTERPRETING DATA Submission date: 21 August 2024 @17h00 INSTRUCTIONS: What you need to submit: 1. Answer ALL questions in the submitted .pdf file using the standard naming convention, for example 2. Submit your workings in EXCEL or Python as supporting documentation using the standard naming convention, for example, 3. All submissions MUST to be made on Efundi. 4. Please note the deadline and ensure that all submissions are received well before the cut off time. DATA: Consider all data as fictions. All data required is available in the accompanying EXCEL spreadsheet "QUESTION 3:12 marks Data in TAB Registration times #2 Big Dreams Campus has spent the past couple of days implementing the recommended interventions from the previous question. Study the data in the following TAB which shows the data from the following 20 days. The data in the table represents a random sample of patients admitted to casualties, where each data point represents one randomly selected patient per shift and the data shows the registration times in minutes. 1) Again, use all the data (sample size is n=60) to draw a histogram with +10 intervals. (2) 2) Describe the data using the mean & the standard deviation and comment on the skewness. (3) 3) Put the data into a frequency table (choose intervals of 1 minute) and calculate the % of observations that show an online registration time of less than 15 min. 4) Determine the 6-sigma limits for this data set by following the below: a. Calculate Lower Limit (LL) = average - (3x standard deviation) (1) b. Calculate Upper Limit (UL) = average + (3x standard deviation) (1) "15.73% 68.27% 15.73% ~__ F Y Y Y =do =30 =20 =lo Oo lo 20 30 do 5) The above graph shows that for a symmetrical distribution, there is approximately 99.73% between the LL and the UL. The Big Dreams Campus expects that 99.73% of the observations to lie between 10 mins and 15 mins, using the above analysis comment (and motivate) of whether the data supports that the intervention improved in line with this expectation or not. (5) Morning Midday Afternoon Day 8h00 to 11h00 11h00 to 14h00 14h00 to 17h00 UTA W N DAY45 11,71 11,72 12,30 DAY46 12,23 12,07 12,46 DAY47 12,04 12,46 12,95 DAY48 14,28 11,22 11,48 8 DAY49 12,98 12,35 12,49 9 DAY50 11,94 12,83 11,33 10 DAY51 11,79 12,65 12,07 11 DAY52 10,57 13,40 12,82 12 DAY53 12,45 12,84 11,47 13 DAY54 13,18 11,23 13,09 14 DAY55 11,90 12,90 12,00 15 DAY56 11,96 12,67 11,43 16 DAY57 11,31 11,83 12,01 17 DAY58 12,47 11,21 12,43 18 DAY59 12,65 11,50 11,43 19 DAY60 13,49 12,44 12,85 20 DAY61 13,82 12,29 10,71 21 DAY62 13,23 10,27 12,54 22 DAY63 13,01 11,75 10,08 23 DAY64 14,26 11,94 13,25
Step by Step Solution
There are 3 Steps involved in it
1 Expert Approved Answer
Step: 1 Unlock
Question Has Been Solved by an Expert!
Get step-by-step solutions from verified subject matter experts
Step: 2 Unlock
Step: 3 Unlock
Students Have Also Explored These Related Mathematics Questions!