

Question: Assume that in the original Ityesi example in Table, all sales actually occur in the United States and are projected to be $60.8 million per
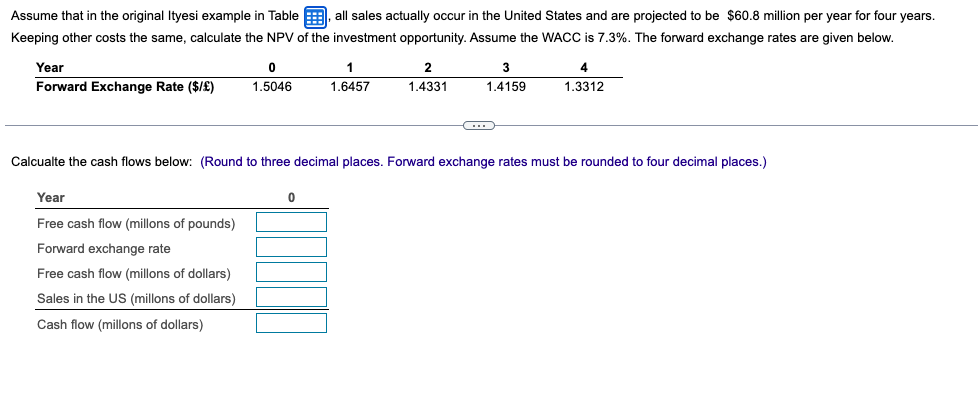
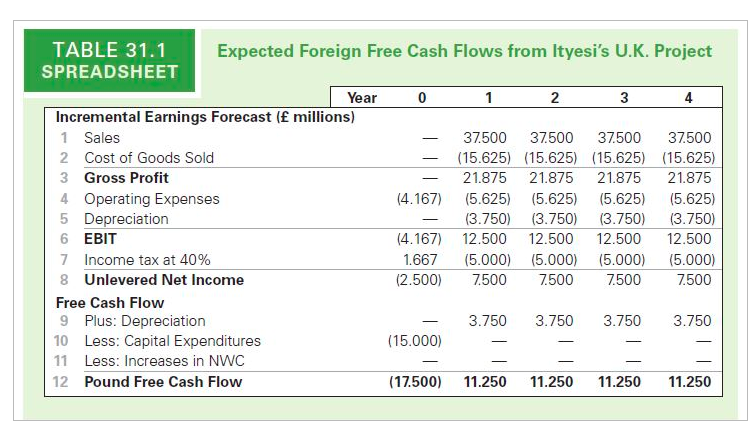
Assume that in the original Ityesi example in Table, all sales actually occur in the United States and are projected to be $60.8 million per year for four years. Keeping other costs the same, calculate the NPV of the investment opportunity. Assume the WACC is 7.3%. The forward exchange rates are given below. Year 0 1 2 3 4 Forward Exchange Rate ($/) 1.5046 1.6457 1.4331 1.4159 1.3312 Calcualte the cash flows below: (Round to three decimal places. Forward exchange rates must be rounded to four decimal places.) Year 0 Free cash flow (millons of pounds) Forward exchange rate Free cash flow (millons of dollars) Sales in the US (millons of dollars) Cash flow (millons of dollars) TABLE 31.1 SPREADSHEET Expected Foreign Free Cash Flows from Ityesi's U.K. Project Year 0 1 2 3 4 Incremental Earnings Forecast ( millions) 1 Sales 2 Cost of Goods Sold 37.500 37.500 37.500 37.500 (15.625) (15.625) (15.625) (15.625) 21.875 21.875 21.875 21.875 (5.625) 3 Gross Profit 4 Operating Expenses (4.167) (5.625) (5.625) (5.625) 5 Depreciation (3.750) (3.750) (3.750) (3.750) 6 EBIT (4.167) 12.500 12.500 12.500 12.500 7 Income tax at 40% 1.667 (5.000) (5.000) (5.000) (5.000) 8 Unlevered Net Income (2.500) 7.500 7.500 7.500 7.500 Free Cash Flow 9 Plus: Depreciation 3.750 3.750 3.750 3.750 10 (15.000) Less: Capital Expenditures 11 Less: Increases in NWC - 12 Pound Free Cash Flow (17.500) 11.250 11.250 11.250 11.250 Assume that in the original Ityesi example in Table, all sales actually occur in the United States and are projected to be $60.8 million per year for four years. Keeping other costs the same, calculate the NPV of the investment opportunity. Assume the WACC is 7.3%. The forward exchange rates are given below. Year 0 1 2 3 4 Forward Exchange Rate ($/) 1.5046 1.6457 1.4331 1.4159 1.3312 Calcualte the cash flows below: (Round to three decimal places. Forward exchange rates must be rounded to four decimal places.) Year 0 Free cash flow (millons of pounds) Forward exchange rate Free cash flow (millons of dollars) Sales in the US (millons of dollars) Cash flow (millons of dollars) TABLE 31.1 SPREADSHEET Expected Foreign Free Cash Flows from Ityesi's U.K. Project Year 0 1 2 3 4 Incremental Earnings Forecast ( millions) 1 Sales 2 Cost of Goods Sold 37.500 37.500 37.500 37.500 (15.625) (15.625) (15.625) (15.625) 21.875 21.875 21.875 21.875 (5.625) 3 Gross Profit 4 Operating Expenses (4.167) (5.625) (5.625) (5.625) 5 Depreciation (3.750) (3.750) (3.750) (3.750) 6 EBIT (4.167) 12.500 12.500 12.500 12.500 7 Income tax at 40% 1.667 (5.000) (5.000) (5.000) (5.000) 8 Unlevered Net Income (2.500) 7.500 7.500 7.500 7.500 Free Cash Flow 9 Plus: Depreciation 3.750 3.750 3.750 3.750 10 (15.000) Less: Capital Expenditures 11 Less: Increases in NWC - 12 Pound Free Cash Flow (17.500) 11.250 11.250 11.250 11.250
Step by Step Solution
There are 3 Steps involved in it

Get step-by-step solutions from verified subject matter experts