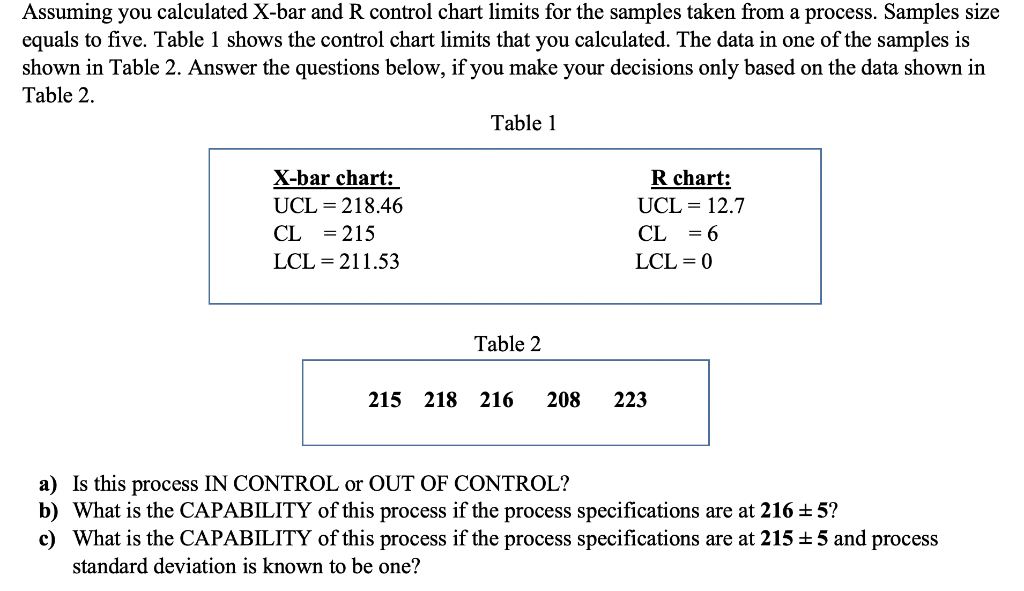
Question: Assuming you calculated X-bar and R control chart limits for the samples taken from a process. Samples size equals to five. Table 1 shows the

Assuming you calculated X-bar and R control chart

Assuming you calculated X-bar and R control chart limits for the samples taken from a process. Samples size equals to five. Table 1 shows the control chart limits that you calculated. The data in one of the samples is shown in Table 2. Answer the questions below, if you make your decisions only based on the data shown in Table 2. Table 1 X-bar chart: UCL = 218.46 CL = 215 LCL = 211.53 R chart: UCL = 12.7 CL = 6 LCL = 0 Table 2 215 218 216 208 223 a) Is this process IN CONTROL or OUT OF CONTROL? b) What is the CAPABILITY of this process if the process specifications are at 216 = 5? c) What is the CAPABILITY of this process if the process specifications are at 215 + 5 and process standard deviation is known to be one

Step by Step Solution

There are 3 Steps involved in it

1 Expert Approved Answer
Step: 1 Unlock blur-text-image
Question Has Been Solved by an Expert!

Get step-by-step solutions from verified subject matter experts

Step: 2 Unlock
Step: 3 Unlock

Students Have Also Explored These Related General Management Questions!