

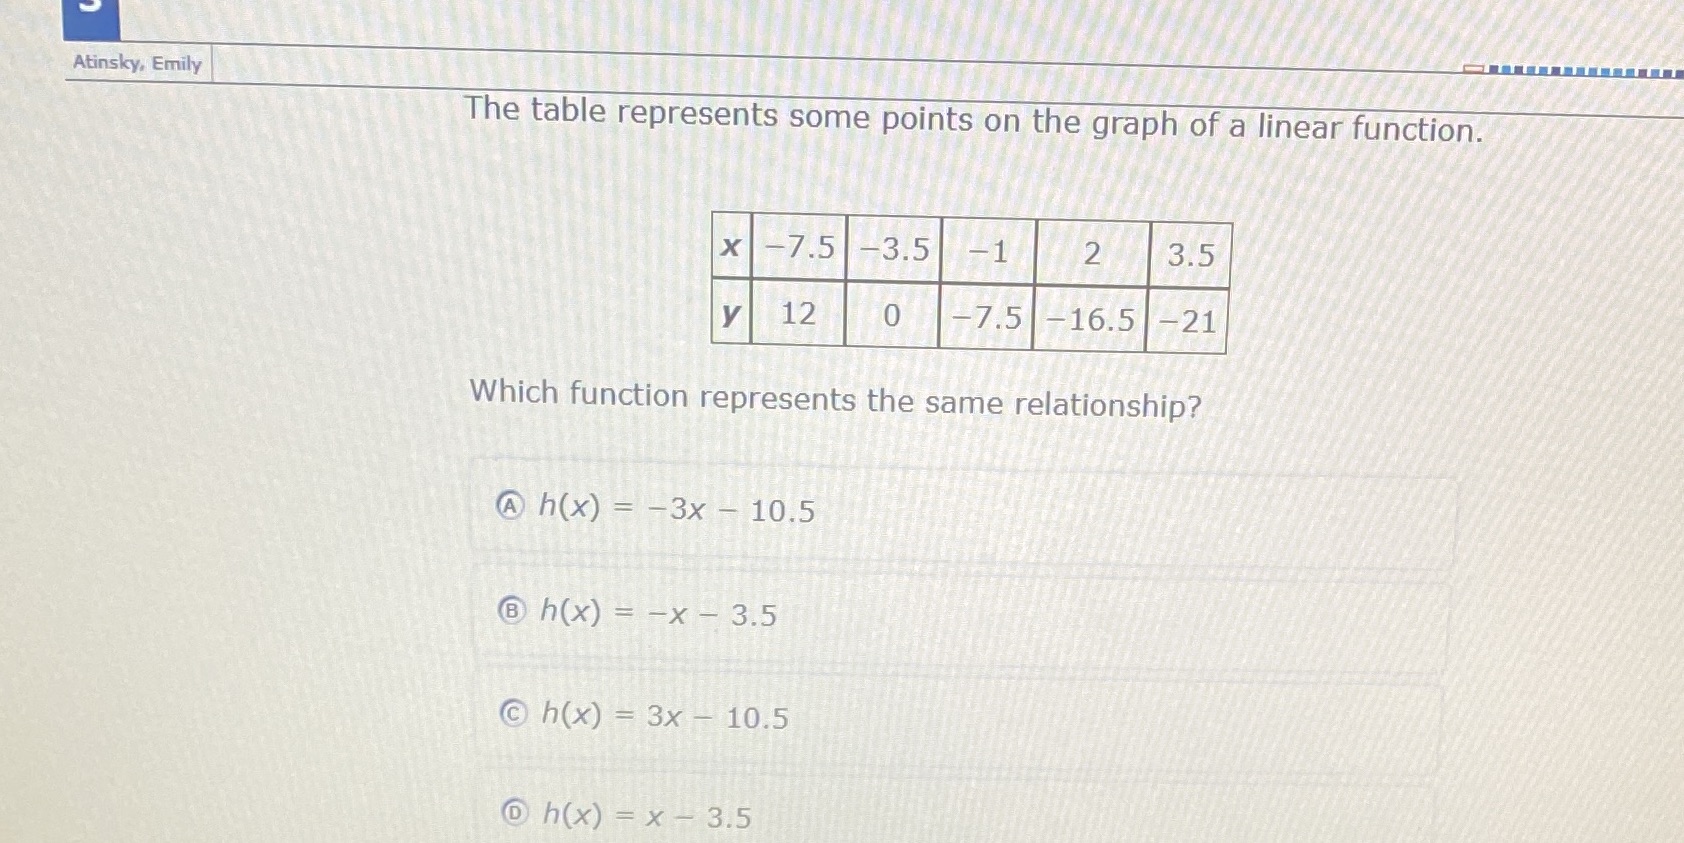
Question: Atinsky, Emily The table represents some points on the graph of a linear function. X -7.5 -3.5 -1 2 3.5 y 12 0 -7.5 -16.5
Step by Step Solution
There are 3 Steps involved in it
1 Expert Approved Answer
Step: 1 Unlock

Question Has Been Solved by an Expert!
Get step-by-step solutions from verified subject matter experts
Step: 2 Unlock
Step: 3 Unlock