

Question: Attempts |:l:l:| Keep the Highest;I 3 3. The effect of negative externalities on the optimal quantity of consumption Consider the market for bolts. Suppose that


![benets, or MP3] curve and the supplyr [marginal private costs, or MIC)](https://s3.amazonaws.com/si.experts.images/answers/2024/06/6675c27c2f80c_5326675c27c14363.jpg)

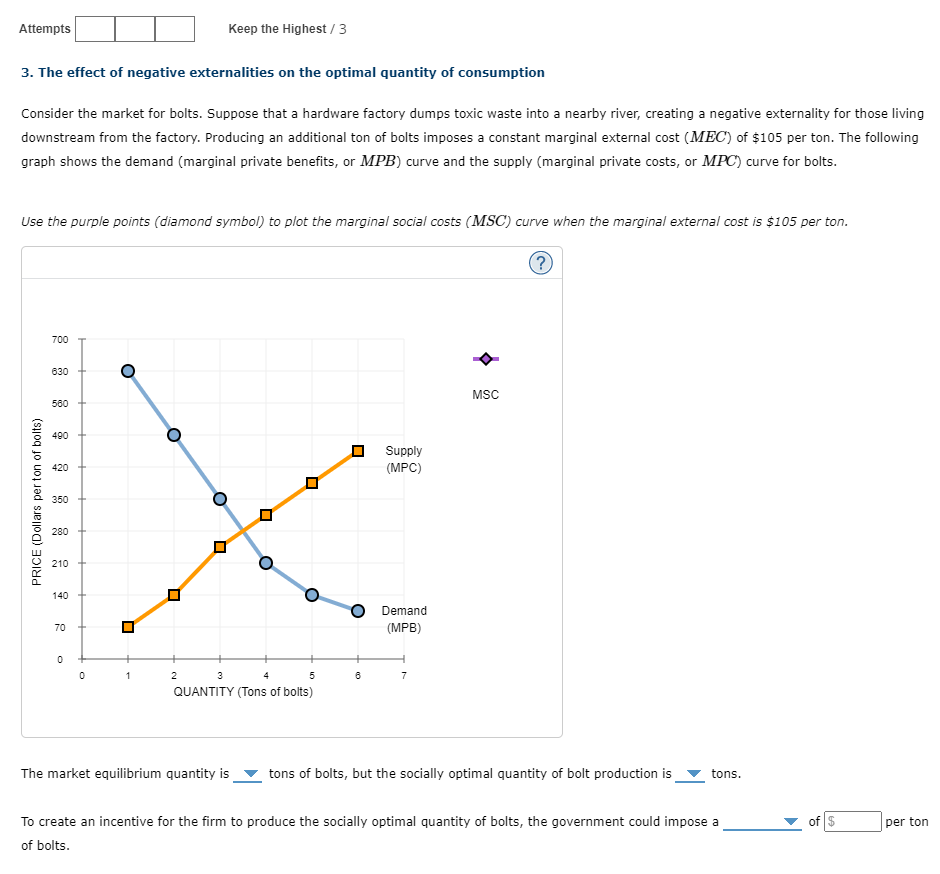
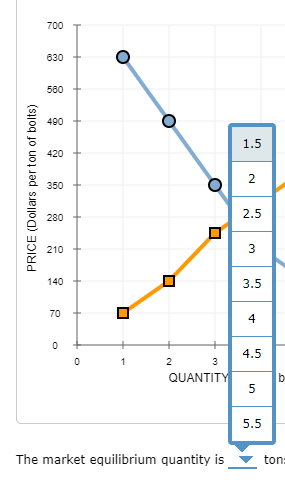
Attempts |:l:l:| Keep the Highest;I 3 3. The effect of negative externalities on the optimal quantity of consumption Consider the market for bolts. Suppose that a hardware factory dumps toxic waste into a nearby river, creating a negative externalitv for those living downstream from the factory. Producing an additional ton of bolts imposes a constant marginal external cost (MEG) of $105 per ton. The following graph shows the demand [marginal private benets, or MP3] curve and the supplyr [marginal private costs, or MIC) curve for bolts. Use the purple points (diamond symboi} to plot the marginai sociai costs (MSG) curve when the marginal externai cost is $105 per ton. C?) 700 630 Misc 560 3'2\" 2 490 .5 SUDD'Y g 420 - (MPG) E n 350 E E a Q 230 LIJ 9 210 cc D. 140 Demand T0 - {MPH} u I. u 1 2 a 4 5 a ? QUANTITY (Tons of bolts] The market equilibrium quantityr is V tons of bolts, but the socialliur optimal quantity of bolt production is 7 tons. To create an incentive for the rm to produce the socially.r optimal quantity.r of bolts, the government could impose a V of per ton of bolts. 700 630 O 580 490 O 1.5 420 2 350 PRICE (Dollars per ton of bolts) 280 2.5 210 3 140 3.5 70 4 4.5 1 2 3 QUANTITY 5 5.5 The market equilibrium quantity is ton
Step by Step Solution
There are 3 Steps involved in it

Get step-by-step solutions from verified subject matter experts