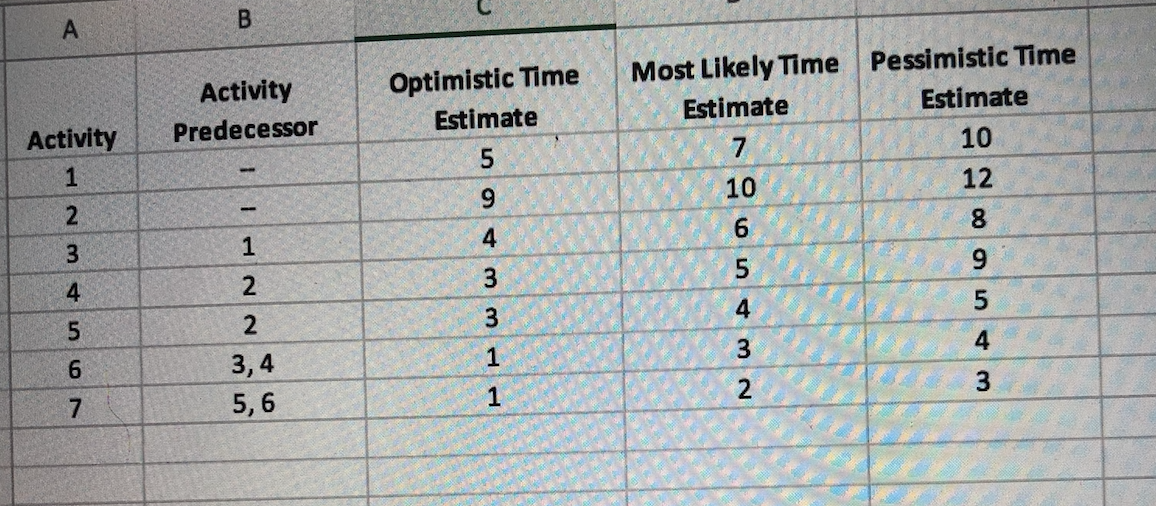
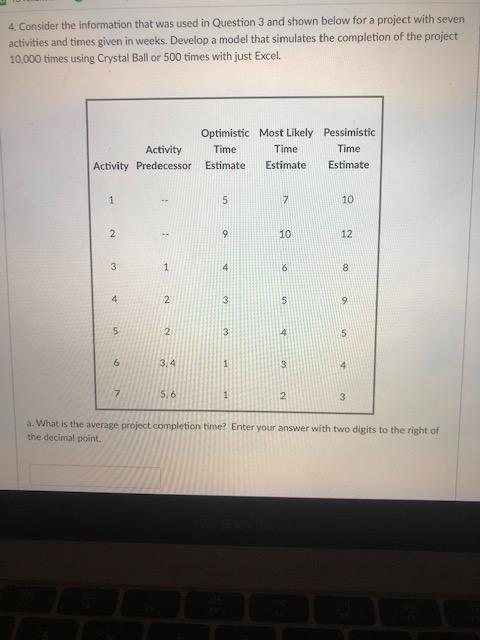
Question: B Pessimistic Time Estimate Activity Predecessor Most Likely Time Estimate Optimistic Time Estimate 5 Activity 7 10 10 12 9 2 8 4 6 3

B Pessimistic Time Estimate Activity PredecessorB Pessimistic Time Estimate Activity PredecessorB Pessimistic Time Estimate Activity Predecessor

B Pessimistic Time Estimate Activity Predecessor Most Likely Time Estimate Optimistic Time Estimate 5 Activity 7 10 10 12 9 2 8 4 6 3 1 5 4 2 3 No - 1 4 0 2 3 1 3 3,4 5,6 2 3 1 4. Consider the information that was used in Question 3 and shown below for a project with seven activities and times given in weeks. Develop a model that simulates the completion of the project 10,000 times using Crystal Ball or 500 times with just Excel. Optimistic Most Likely Pessimistic Activity Time Time Time Activity Predecessor Estimate Estimate Estimate 1 5 7 10 2 10 12 3 1 4 6 8 4 2 3 5 9 5 2 3 4 5 6 3,4 1 3 4 7 5,6 1 2 3 a. What is the average project completion time? Enter your answer with two digits to the right of the decimal point Question 18 b. What is the standard deviation of the project completion time? Enter your answer with tw digits to the right of the decimal place. Question 19 c. What is the probability that the project can be completed in 19 weeks or less? Enter your answer as a percentage with two digits to the right of the decimal place. Question 20 5 d. What is the probability that the project will take 20 weeks or longer? Enter your answer as a percentage with two digits to the right of the decimal place

Step by Step Solution

There are 3 Steps involved in it

1 Expert Approved Answer
Step: 1 Unlock blur-text-image
Question Has Been Solved by an Expert!

Get step-by-step solutions from verified subject matter experts

Step: 2 Unlock
Step: 3 Unlock

Students Have Also Explored These Related General Management Questions!