

Question: b) with z=3, the control limits for the mean chart are: UCL-x= LCL-x= c) thr control limits for the R-charts are: UCLr= LCLr= need a,b,&
b) with z=3, the control limits for the mean chart are:
UCL-x=
LCL-x=
c) thr control limits for the R-charts are:
UCLr=
LCLr=
need a,b,& c answers 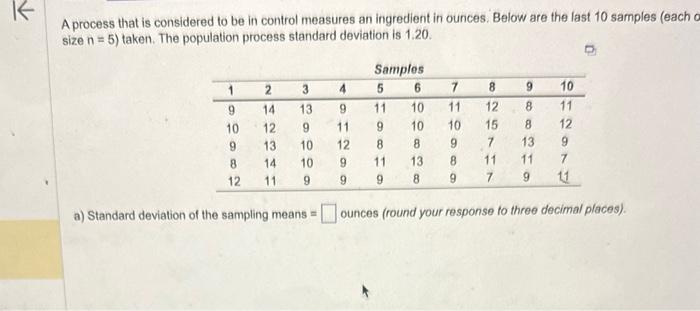
A process that is considered to be in control measures an ingredient in ounces. Below are the last 10 samples (each o size n=5 ) taken. The population process standard deviation is 1.20. a) Standard deviation of the sampling means = ounces (round your response to three decimal places)
Step by Step Solution
There are 3 Steps involved in it
1 Expert Approved Answer
Step: 1 Unlock

Question Has Been Solved by an Expert!
Get step-by-step solutions from verified subject matter experts
Step: 2 Unlock
Step: 3 Unlock