

Question: Based on the information ratios calculated in #4, is the performance of A & B statistically significantly different from zero at the 95% & 99%
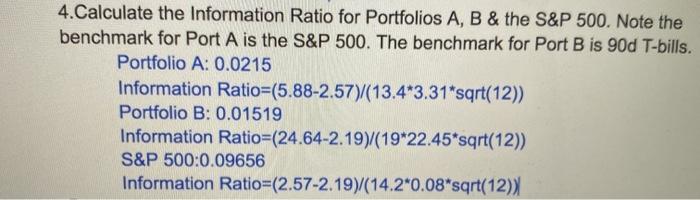
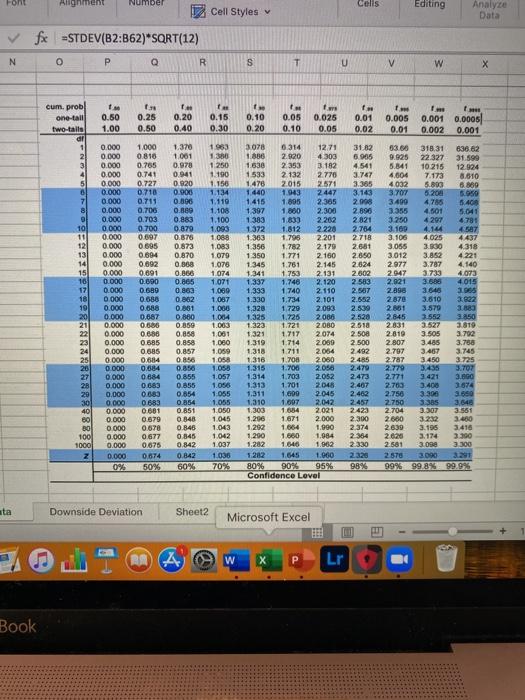
4.Calculate the Information Ratio for Portfolios A, B & the S&P 500. Note the benchmark for Port A is the S&P 500. The benchmark for Port B is 90d T-bills. Portfolio A: 0.0215 Information Ratio=(5.88-2.57)/(13.4*3.31*sqrt(12)) Portfolio B: 0.01519 Information Ratio=(24.64-2.19)/(19*22.45*sqrt(12) S&P 500:0.09656 Information Ratio=(2.57-2.19)/(14.2-0.08*sqrt(12) Font Alignment Number cells Editing Cell Styles Analyze Data fx =STDEV(B2:B62)* SORT(12) N o P Q R S T U V w 0.20 cum, probl one-tall two tails dr 0.50 1.00 0.26 0.50 0.15 0.30 0.10 0.20 0.40 0.05 0.10 0.025 0.05 0.01 0.02 Ime 0.001 0.002 0.005 0.01 mes 0.0005 0.001 5 6 7 8 9 10 11 12 13 14 15 16 17 18 19 20 21 22 23 24 25 26 27 28 20 30 40 60 BO 0.000 0.000 0.000 0.000 0.000 0.000 0.000 0.000 0.000 0.000 0.000 0.000 0.000 0.000 0.000 0.000 0.000 0.000 0.000 0.000 0.000 0.000 0.000 0.000 0.000 0.000 0.000 0.000 0.000 0.000 0.000 0.000 0.000 0.000 0.000 0.000 0% 1.000 0.810 0.765 0.741 0.727 0.710 0.711 0.706 0.703 0.700 0.697 0695 0.694 0.692 0.691 0.890 0.689 0.688 0.688 0.667 0.680 0.686 0.685 0.685 0.684 0.684 0684 0683 0.680 0683 0.601 0.879 0670 0.677 0,075 0.674 50% 1.370 1.001 0.978 0.941 0.920 0.900 0.500 0.889 0.883 0.870 0.876 0.873 0.870 0.888 0.866 0.865 0.863 0.862 0.861 0.880 0.850 0.850 0.858 0.857 0.8.56 0.856 0.855 0.855 0.654 0.854 0.651 0.848 0.846 0.845 0.842 0 842 60% 1.963 1300 1250 1.190 1.156 1.134 1.110 1.108 1.100 1.093 1.088 1.083 1.079 1.076 1.074 1.071 1.069 1.087 1.000 1.004 1.003 1.001 1.000 1.059 1.058 1.053 1.057 1.056 1055 1.055 1.050 3078 6.314 1271 1.836 2.920 4 303 1630 2 353 3.182 1533 2132 2.770 1.478 2.015 2.571 1.440 1.943 2447 1.415 1.805 2,365 1.397 1,800 2.300 1383 1.833 1372 1.812 2220 1363 1.795 2.201 1 356 1.782 2.170 1.350 1.771 2160 1.345 1.761 2.145 1.341 1.753 2.131 1.337 1.746 2.120 1,333 1 740 2.110 1.330 1,734 2.101 1,320 1.720 2.093 1.325 1.725 2006 1.323 1.721 2080 1.325 1.717 2074 1.319 1.714 2000 1.318 1.711 2.054 1.316 1.700 2080 1.315 1.700 2.056 1.314 1.703 2052 1.313 1.701 2.048 1.311 1.600 2.045 1.310 1.097 2.042 1.300 1654 2021 1.296 1.671 2.000 1.292 1.664 1.990 1 290 1.680 1,984 1.282 1.646 1.962 1.282 1.645 1.000 80% 90% 95% Confidence Level 31.82 6.965 4541 3.767 3.365 3.143 2008 2 890 2.821 2.764 2718 2.681 2.850 2.624 2.602 2.583 2.567 2.552 2.530 2.520 2.518 2.508 2.500 2492 2.4R5 2.479 2.473 2.467 2.462 2457 2423 2.300 2 374 2354 2 330 2320 98% 63.60 318 31 636.62 9.925 22 327 31.599 5.841 10.215 12924 6,604 7.173 8.610 4,032 5.800 6.869 3.707 5.203 3.490 4785 5.400 3.355 4.501 5.041 3.250 4297 4781 3.100 4.14 4.587 3.106 4.025 4.437 3.055 3.830 4.318 3.012 3.852 4221 2.977 3.787 4.140 2.947 3.733 4,073 2.921 3.686 4015 2.898 3646 3.965 2.870 3.610 3.822 2.881 3.579 3.883 2.845 3.552 3.850 2831 3.527 1810 2.819 3.505 3.792 2.807 3.485 3.758 2.797 3.467 3.745 2787 3450 3.725 2.770 3.435 3.707 2.771 3.421 3.600 2.763 3.400 3.674 2.750 3.300 2750 3.385 3.640 2.704 3.307 3561 2650 3.232 3.480 2639 3.195 3.416 2.620 3.174 3.390 2.581 3.0se 3.300 2570 3090 3.291 99% 99.8% 99.9% 1045 1000 Z 1.043 1.042 1.037 1.036 70% ata Downside Deviation Sheet2 Microsoft Excel A Lr Book 4.Calculate the Information Ratio for Portfolios A, B & the S&P 500. Note the benchmark for Port A is the S&P 500. The benchmark for Port B is 90d T-bills. Portfolio A: 0.0215 Information Ratio=(5.88-2.57)/(13.4*3.31*sqrt(12)) Portfolio B: 0.01519 Information Ratio=(24.64-2.19)/(19*22.45*sqrt(12) S&P 500:0.09656 Information Ratio=(2.57-2.19)/(14.2-0.08*sqrt(12) Font Alignment Number cells Editing Cell Styles Analyze Data fx =STDEV(B2:B62)* SORT(12) N o P Q R S T U V w 0.20 cum, probl one-tall two tails dr 0.50 1.00 0.26 0.50 0.15 0.30 0.10 0.20 0.40 0.05 0.10 0.025 0.05 0.01 0.02 Ime 0.001 0.002 0.005 0.01 mes 0.0005 0.001 5 6 7 8 9 10 11 12 13 14 15 16 17 18 19 20 21 22 23 24 25 26 27 28 20 30 40 60 BO 0.000 0.000 0.000 0.000 0.000 0.000 0.000 0.000 0.000 0.000 0.000 0.000 0.000 0.000 0.000 0.000 0.000 0.000 0.000 0.000 0.000 0.000 0.000 0.000 0.000 0.000 0.000 0.000 0.000 0.000 0.000 0.000 0.000 0.000 0.000 0.000 0% 1.000 0.810 0.765 0.741 0.727 0.710 0.711 0.706 0.703 0.700 0.697 0695 0.694 0.692 0.691 0.890 0.689 0.688 0.688 0.667 0.680 0.686 0.685 0.685 0.684 0.684 0684 0683 0.680 0683 0.601 0.879 0670 0.677 0,075 0.674 50% 1.370 1.001 0.978 0.941 0.920 0.900 0.500 0.889 0.883 0.870 0.876 0.873 0.870 0.888 0.866 0.865 0.863 0.862 0.861 0.880 0.850 0.850 0.858 0.857 0.8.56 0.856 0.855 0.855 0.654 0.854 0.651 0.848 0.846 0.845 0.842 0 842 60% 1.963 1300 1250 1.190 1.156 1.134 1.110 1.108 1.100 1.093 1.088 1.083 1.079 1.076 1.074 1.071 1.069 1.087 1.000 1.004 1.003 1.001 1.000 1.059 1.058 1.053 1.057 1.056 1055 1.055 1.050 3078 6.314 1271 1.836 2.920 4 303 1630 2 353 3.182 1533 2132 2.770 1.478 2.015 2.571 1.440 1.943 2447 1.415 1.805 2,365 1.397 1,800 2.300 1383 1.833 1372 1.812 2220 1363 1.795 2.201 1 356 1.782 2.170 1.350 1.771 2160 1.345 1.761 2.145 1.341 1.753 2.131 1.337 1.746 2.120 1,333 1 740 2.110 1.330 1,734 2.101 1,320 1.720 2.093 1.325 1.725 2006 1.323 1.721 2080 1.325 1.717 2074 1.319 1.714 2000 1.318 1.711 2.054 1.316 1.700 2080 1.315 1.700 2.056 1.314 1.703 2052 1.313 1.701 2.048 1.311 1.600 2.045 1.310 1.097 2.042 1.300 1654 2021 1.296 1.671 2.000 1.292 1.664 1.990 1 290 1.680 1,984 1.282 1.646 1.962 1.282 1.645 1.000 80% 90% 95% Confidence Level 31.82 6.965 4541 3.767 3.365 3.143 2008 2 890 2.821 2.764 2718 2.681 2.850 2.624 2.602 2.583 2.567 2.552 2.530 2.520 2.518 2.508 2.500 2492 2.4R5 2.479 2.473 2.467 2.462 2457 2423 2.300 2 374 2354 2 330 2320 98% 63.60 318 31 636.62 9.925 22 327 31.599 5.841 10.215 12924 6,604 7.173 8.610 4,032 5.800 6.869 3.707 5.203 3.490 4785 5.400 3.355 4.501 5.041 3.250 4297 4781 3.100 4.14 4.587 3.106 4.025 4.437 3.055 3.830 4.318 3.012 3.852 4221 2.977 3.787 4.140 2.947 3.733 4,073 2.921 3.686 4015 2.898 3646 3.965 2.870 3.610 3.822 2.881 3.579 3.883 2.845 3.552 3.850 2831 3.527 1810 2.819 3.505 3.792 2.807 3.485 3.758 2.797 3.467 3.745 2787 3450 3.725 2.770 3.435 3.707 2.771 3.421 3.600 2.763 3.400 3.674 2.750 3.300 2750 3.385 3.640 2.704 3.307 3561 2650 3.232 3.480 2639 3.195 3.416 2.620 3.174 3.390 2.581 3.0se 3.300 2570 3090 3.291 99% 99.8% 99.9% 1045 1000 Z 1.043 1.042 1.037 1.036 70% ata Downside Deviation Sheet2 Microsoft Excel A Lr Book
Step by Step Solution
There are 3 Steps involved in it

Get step-by-step solutions from verified subject matter experts