

Question: Based on the table answer question and show work please. 1 . Based on the data presented in table 2 , calculate the relative risk
Based on the table answer question and show work please.
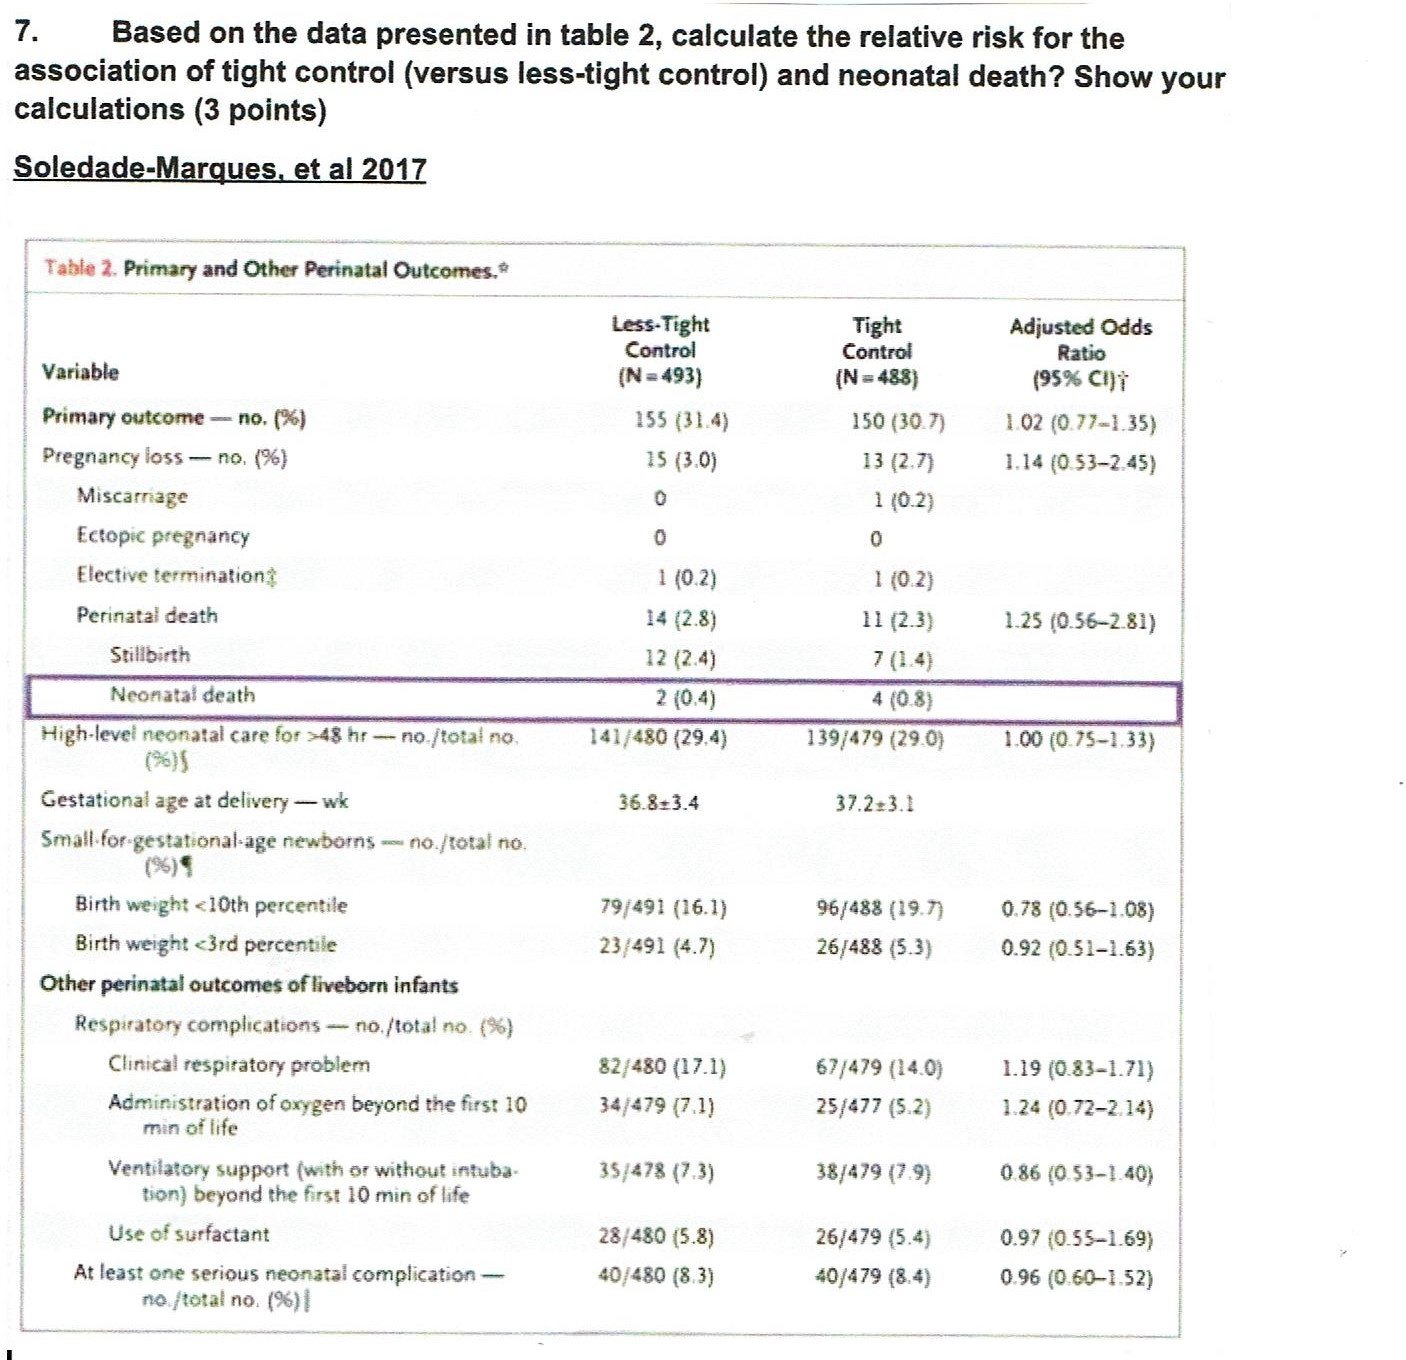
1 . Based on the data presented in table 2 , calculate the relative risk for the association of tight control ( versus less -tight control) and neonatal death ? Show your calculations ( 3 points ) Soledade - Marques , et al 2017 Table 2. Primary and Other Perinatal Outcomes ,*\\ Less - Tight Tight Adjusted Odds Control Control Ratio Variable IN = $93| IN = $8.81 195% CIT Primary outcome - no . 1946 ) 155 ( 31. 4) 150 ( 30.7) 1.02 1 0. 77 - 1.35 ) Pregnancy loss - no. 196 ) 15 ( 3.01 13 / 2. 7) 1 . 1 4 1 0.53 - 2. 45 ) Miscarriage 1 10.2 ) Ectopic Pregnancy O O Elective termination 1 1 0.21 1 1 0.2 ) Perinatal death 14 ( 2.8 ) 1 1 1 2.3 ) 1.25 1 0. 56 - 2.81) Stillbirths 12 ( 2.4 1 7 ( 1. 41 Neonatal death 2 10. 4) 4 10.81 High- level neonatal care for =_ AS hr - no. / total no 141 / 480 ( 29. 4 ) 139 / 479 ( 29. 01 1.00 10. 75- 1.33) 136)5 Gestationalage at delivery - wk 36.8 + 3.4 37.2 = 3. 1 Small for gestational age newborns - no. / total no` Birth weight cloth percentile 19 1 431 ( 16 . 1 ) 96 / 088 (19. 7 ) 0. 78 1 0. 56 - 1.08 ) Birth weight
Step by Step Solution
There are 3 Steps involved in it

Get step-by-step solutions from verified subject matter experts