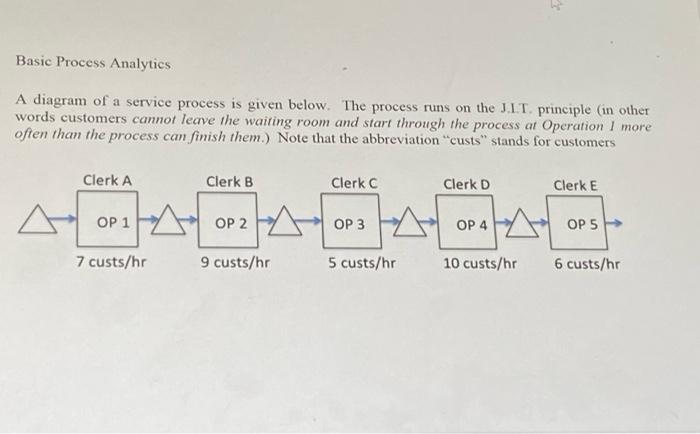
Question: Basic Process Analytics A diagram of a service process is given below. The process runs on the J.LT principle (in other words customers cannot leave

Basic Process Analytics A diagram of a service
Basic Process Analytics A diagram of a service process is given below. The process runs on the J.LT principle (in other words customers cannot leave the waiting room and start through the process at Operation I more often than the process can finish them.) Note that the abbreviation "custs" stands for customers Clerk A Clerk B Clerk C Clerk D Clerk E 4 034140024 A OP 1 OP 2 OP 3 OP 4 OP 5 LL 7 custs/hr 9 custs/hr 5 custs/hr 10 custs/hr 6 custs/hr Assuming that the Flowtime of the process is 1 hour, what is the total amount of time the average customer spends waiting lle is not being seen by a cerk) throughout the process? ents O 167 hours 06 hours O 0.72 hours O 0.20 hours O 0,08 hours Question 9 1 pts Assume that instead of JIT, you use a material release policy in which each operation operates as quickly as it can. The arrival rate to the process rises from 3 customers per hour to 9 customers per hour. (Neither of these are necessarily the correct answers to any prior problem.) What will happen over time with respect to the waiting line between operation 2 and operation 3? The length will decrease to a new stable length greater than zero The length will decrease to zero More information is needed to answer the question The length will keep increasing forever The length will rise to a new stable length

Step by Step Solution

There are 3 Steps involved in it

1 Expert Approved Answer
Step: 1 Unlock blur-text-image
Question Has Been Solved by an Expert!

Get step-by-step solutions from verified subject matter experts

Step: 2 Unlock
Step: 3 Unlock

Students Have Also Explored These Related General Management Questions!