

Question: begin{tabular}{|r|r|} hline Lambda & 10 Mu & 12 hline Probability system is empty & 0.167 cline { 2 - 2 } &
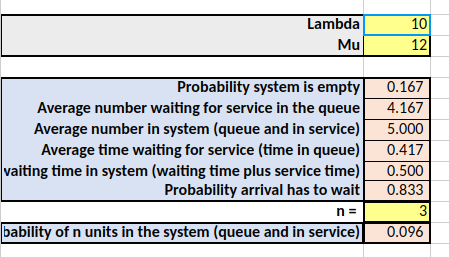
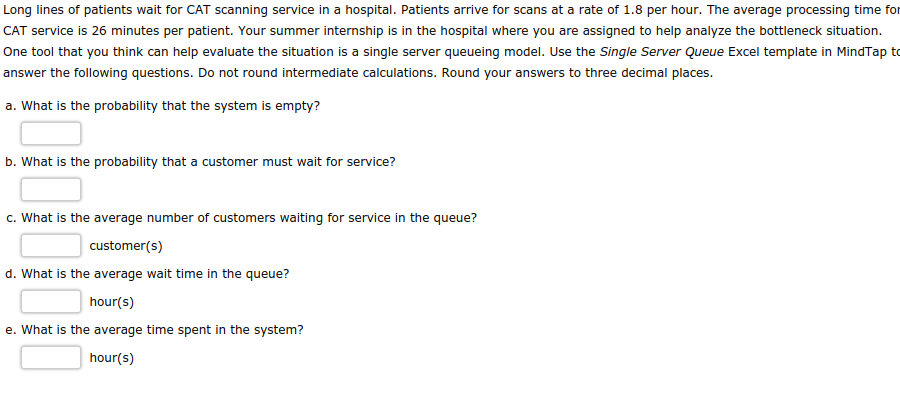
\begin{tabular}{|r|r|} \hline Lambda & 10 \\ Mu & 12 \\ \hline Probability system is empty & 0.167 \\ \cline { 2 - 2 } & 4.167 \\ \hline Average number waiting for service in the queue & \\ Average number in system (queue and in service) & 5.000 \\ Average time waiting for service (time in queue) & 0.417 \\ \cline { 2 - 2 } Paiting time in system (waiting time plus service time) & 0.500 \\ \cline { 2 - 2 } & 0.833 \\ \hline Probability arrival has to wait & n= \\ \hline bability of n units in the system (queue and in service) & 0.096 \\ \hline \end{tabular} Long lines of patients wait for CAT scanning service in a hospital. Patients arrive for scans at a rate of 1.8 per hour. The average processing time fol CAT service is 26 minutes per patient. Your summer internship is in the hospital where you are assigned to help analyze the bottleneck situation. One tool that you think can help evaluate the situation is a single server queueing model. Use the Single Server Queue Excel template in MindTap to answer the following questions. Do not round intermediate calculations. Round your answers to three decimal places. a. What is the probability that the system is empty? b. What is the probability that a customer must wait for service? c. What is the average number of customers waiting for service in the queue? customer(s) d. What is the average wait time in the queue? hour(s) e. What is the average time spent in the system? hour(s)
Step by Step Solution
There are 3 Steps involved in it

Get step-by-step solutions from verified subject matter experts