

Question: begin{tabular}{|r|r|} hline multicolumn{1}{|c|}{ A } & multicolumn{1}{|c|}{ B } hline Happiness & Age hline 62 & 49 hline 66 & 51
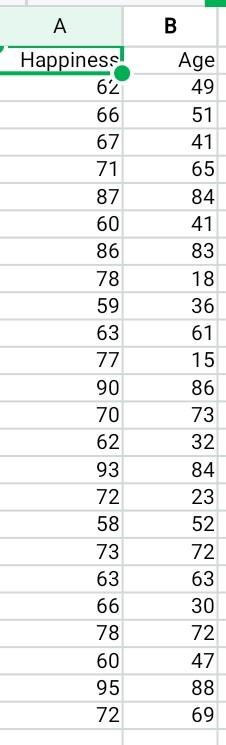
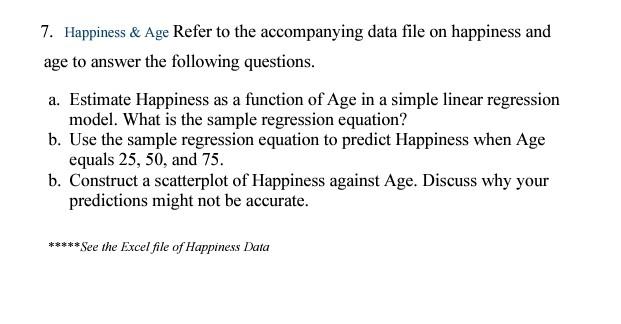
\begin{tabular}{|r|r|} \hline \multicolumn{1}{|c|}{ A } & \multicolumn{1}{|c|}{ B } \\ \hline Happiness & Age \\ \hline 62 & 49 \\ \hline 66 & 51 \\ \hline 67 & 41 \\ \hline 71 & 65 \\ \hline 87 & 84 \\ \hline 60 & 41 \\ \hline 86 & 83 \\ \hline 78 & 18 \\ \hline 59 & 36 \\ \hline 63 & 61 \\ \hline 77 & 15 \\ \hline 90 & 86 \\ \hline 70 & 73 \\ \hline 62 & 32 \\ \hline 93 & 84 \\ \hline 72 & 23 \\ \hline 58 & 52 \\ \hline 73 & 72 \\ \hline 63 & 63 \\ \hline 66 & 30 \\ \hline 78 & 72 \\ \hline 60 & 47 \\ \hline 95 & 88 \\ \hline 72 & 69 \\ \hline \end{tabular} 7. Happiness \& Age Refer to the accompanying data file on happiness and age to answer the following questions. a. Estimate Happiness as a function of Age in a simple linear regression model. What is the sample regression equation? b. Use the sample regression equation to predict Happiness when Age equals 25,50 , and 75 . b. Construct a scatterplot of Happiness against Age. Discuss why your predictions might not be accurate. ***** See the Excel file of Happiness Data \begin{tabular}{|r|r|} \hline \multicolumn{1}{|c|}{ A } & \multicolumn{1}{|c|}{ B } \\ \hline Happiness & Age \\ \hline 62 & 49 \\ \hline 66 & 51 \\ \hline 67 & 41 \\ \hline 71 & 65 \\ \hline 87 & 84 \\ \hline 60 & 41 \\ \hline 86 & 83 \\ \hline 78 & 18 \\ \hline 59 & 36 \\ \hline 63 & 61 \\ \hline 77 & 15 \\ \hline 90 & 86 \\ \hline 70 & 73 \\ \hline 62 & 32 \\ \hline 93 & 84 \\ \hline 72 & 23 \\ \hline 58 & 52 \\ \hline 73 & 72 \\ \hline 63 & 63 \\ \hline 66 & 30 \\ \hline 78 & 72 \\ \hline 60 & 47 \\ \hline 95 & 88 \\ \hline 72 & 69 \\ \hline \end{tabular} 7. Happiness \& Age Refer to the accompanying data file on happiness and age to answer the following questions. a. Estimate Happiness as a function of Age in a simple linear regression model. What is the sample regression equation? b. Use the sample regression equation to predict Happiness when Age equals 25,50 , and 75 . b. Construct a scatterplot of Happiness against Age. Discuss why your predictions might not be accurate. ***** See the Excel file of Happiness Data
Step by Step Solution
There are 3 Steps involved in it

Get step-by-step solutions from verified subject matter experts