

Question: Below is a table of data collected over a six-month period in a local grocery store. Construct a Pareto analysis of the data and determine
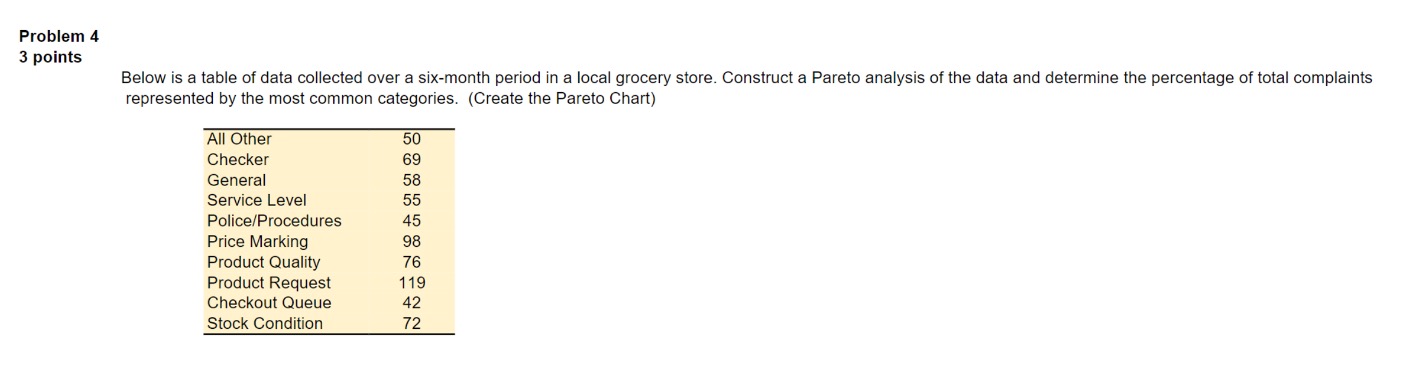
Below is a table of data collected over a six-month period in a local grocery store. Construct a Pareto analysis of the data and determine the percentage of total complaints represented by the most common categories. (Create the Pareto Chart)
Step by Step Solution
There are 3 Steps involved in it
1 Expert Approved Answer
Step: 1 Unlock

Question Has Been Solved by an Expert!
Get step-by-step solutions from verified subject matter experts
Step: 2 Unlock
Step: 3 Unlock