

Question: Below is a table of data collected over a six-month period in a local grocery store. Construct a Pareto analysis of the data and determine
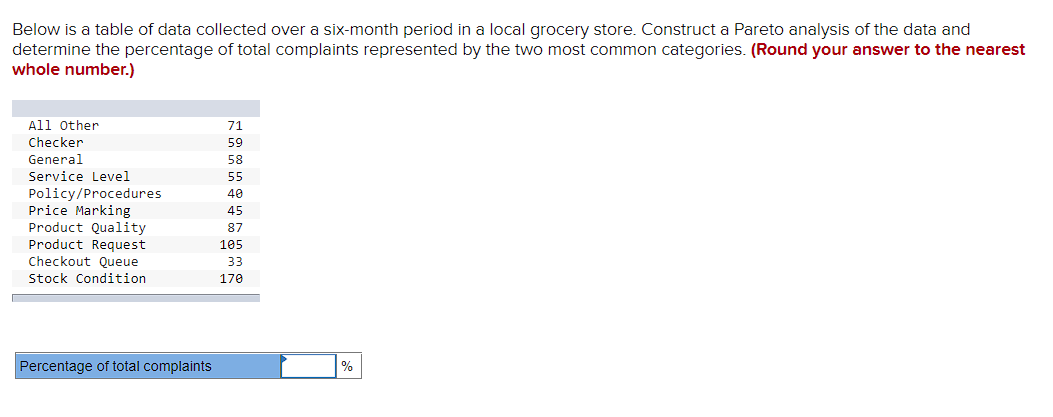
Below is a table of data collected over a six-month period in a local grocery store. Construct a Pareto analysis of the data and determine the percentage of total complaints represented by the two most common categories. (Round your answer to the nearest whole number.) Below is a table of data collected over a six-month period in a local grocery store. Construct a Pareto analysis of the data and determine the percentage of total complaints represented by the two most common categories. (Round your answer to the nearest whole number.)
Step by Step Solution
There are 3 Steps involved in it
1 Expert Approved Answer
Step: 1 Unlock

Question Has Been Solved by an Expert!
Get step-by-step solutions from verified subject matter experts
Step: 2 Unlock
Step: 3 Unlock