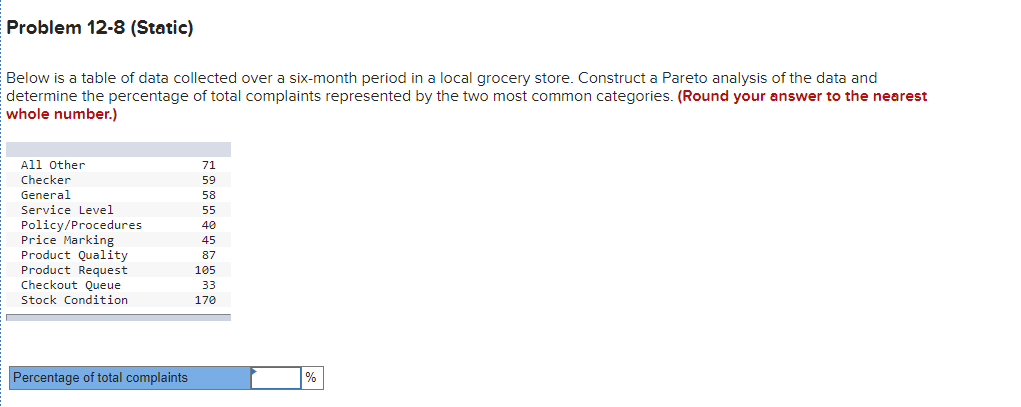
Question: Problem 12-8 (Static) Below is a table of data collected over a six-month period in a local grocery store. Construct a Pareto analysis of the

Problem 12-8 (Static) Below is a table of data

Problem 12-8 (Static) Below is a table of data collected over a six-month period in a local grocery store. Construct a Pareto analysis of the data and determine the percentage of total complaints represented by the two most common categories. (Round your answer to the nearest whole number.) All Other Checker General Service Level Policy/Procedures Price Marking Product Quality Product Request Checkout Queue Stock Condition 71 59 58 55 40 45 87 105 33 170 Percentage of total complaints %

Step by Step Solution

There are 3 Steps involved in it

1 Expert Approved Answer
Step: 1 Unlock blur-text-image
Question Has Been Solved by an Expert!

Get step-by-step solutions from verified subject matter experts

Step: 2 Unlock
Step: 3 Unlock

Students Have Also Explored These Related General Management Questions!