

Question: Below is an E chart for a process. Based on this chart. is the process statistically stable? 5 UCL 4. 3 use rite rlin e
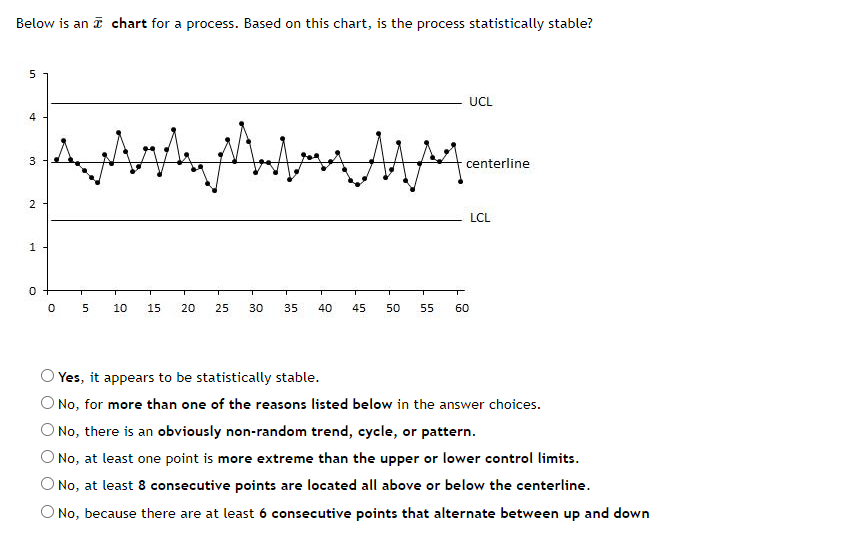

Below is an E chart for a process. Based on this chart. is the process statistically stable? 5 UCL 4. 3 use rite rlin e 2 LCL 1 D '3:_:3' Yes. it appears to be statistically stable. No, for more than one of the reasons listed below in the answer choices. '3' No, there is an obviously non-random trend, cycle, or pattern. No, at least one point is more extreme than the upper or lower control limits. He, at least 8 consecutive points are located all above or below the centerline. No, because there are at least on consecutive points that alternate between up and down
Step by Step Solution
There are 3 Steps involved in it
1 Expert Approved Answer
Step: 1 Unlock

Question Has Been Solved by an Expert!
Get step-by-step solutions from verified subject matter experts
Step: 2 Unlock
Step: 3 Unlock