

Question: Below is an E chart for a process. Based on this chart. is the process statistically stable? 5 UCL 3 centerline 1 LCL '1:3'Yes, it
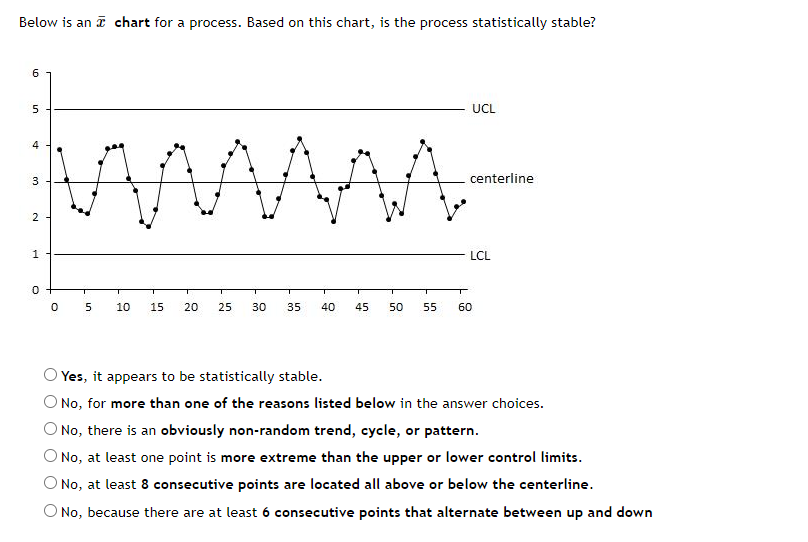
Below is an E chart for a process. Based on this chart. is the process statistically stable? 5 UCL 3 centerline 1 LCL '1:3'Yes, it appears to be statistically stable. '22} No. for more than one of the reasons listed below in the answer choices. '12:? No, there is an obviously:r non-random trend, cycle, or pattern. '12:? H0. at least one point is more extreme than the upper or lower control limits. '12} He. at least 8 consecutive points are located all above or below the centerline. No, because there are at least o consecutive points that alternate between up and down
Step by Step Solution
There are 3 Steps involved in it
1 Expert Approved Answer
Step: 1 Unlock

Question Has Been Solved by an Expert!
Get step-by-step solutions from verified subject matter experts
Step: 2 Unlock
Step: 3 Unlock