

Question: bert Format Arrange view Share Chapter 2 Worksheet_Secs 2.4 - 2.7_for Backboard (1) - Edited A D 125% + Media Collab iew Zoom Add Page
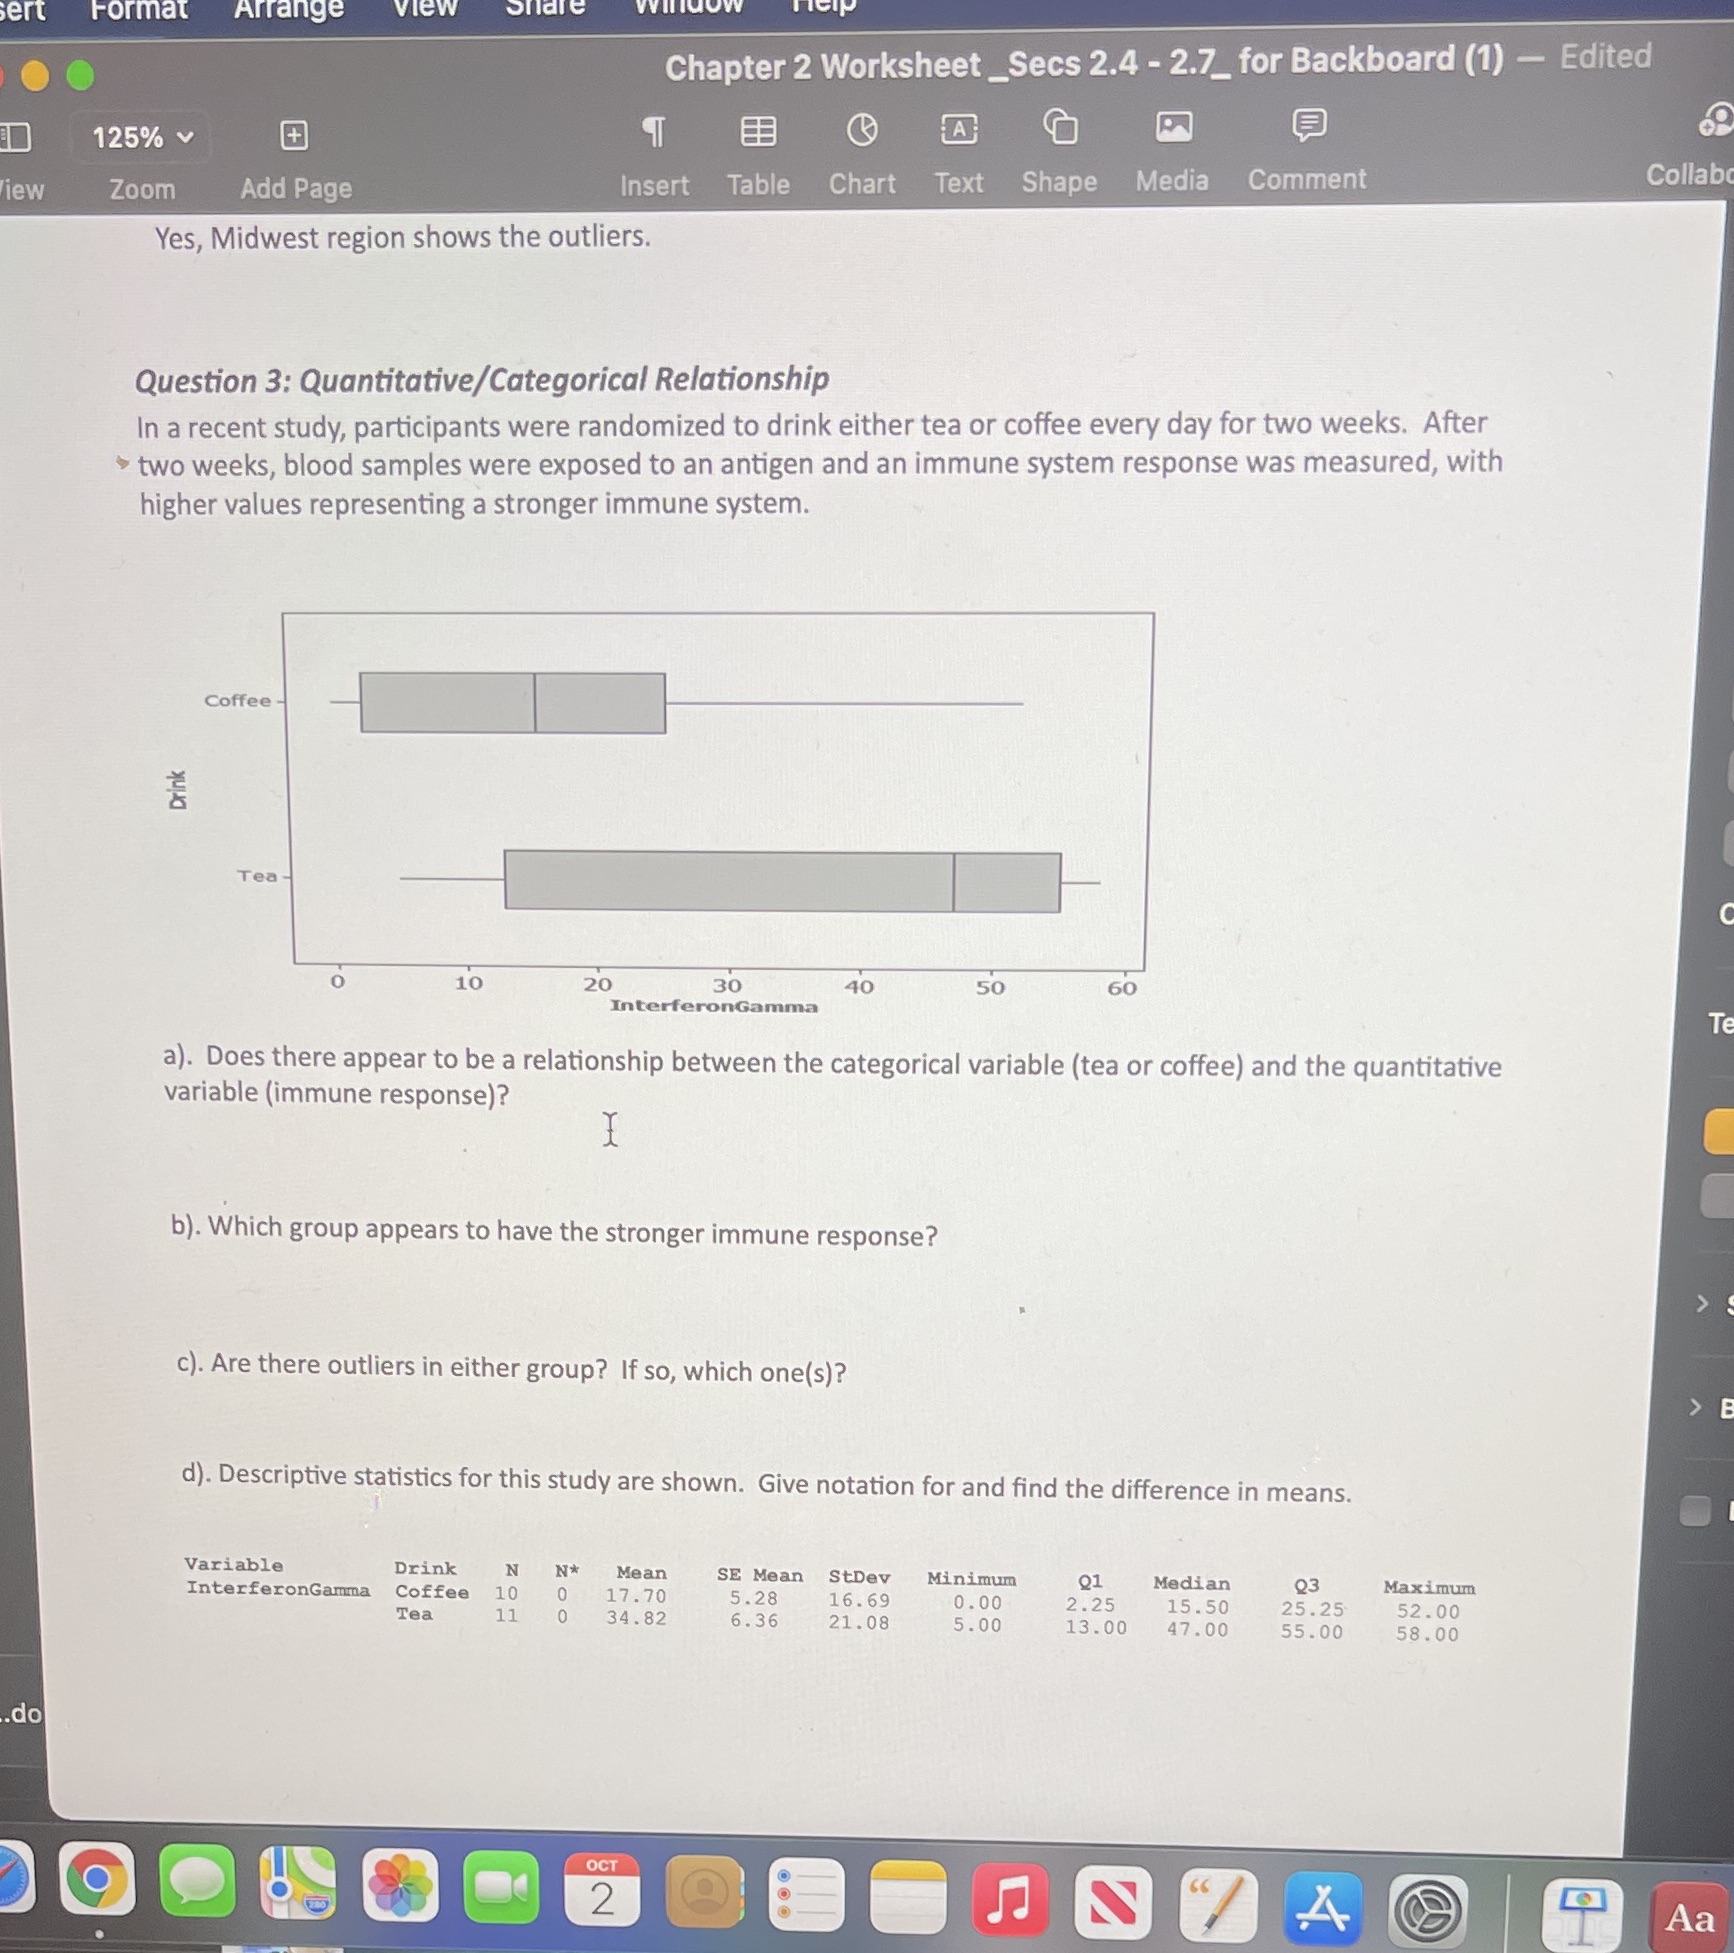
bert Format Arrange view Share Chapter 2 Worksheet_Secs 2.4 - 2.7_for Backboard (1) - Edited A D 125% + Media Collab iew Zoom Add Page Insert Table Chart Text Shape Comment Yes, Midwest region shows the outliers. Question 3: Quantitative/Categorical Relationship In a recent study, participants were randomized to drink either tea or coffee every day for two weeks. After two weeks, blood samples were exposed to an antigen and an immune system response was measured, with higher values representing a stronger immune system. Coffee Drink Tea 10 20 30 40 50 60 InterferonGamma a). Does there appear to be a relationship between the categorical variable (tea or coffee) and the quantitative variable (immune response)? I b). Which group appears to have the stronger immune response? c). Are there outliers in either group? If so, which one(s)? d). Descriptive statistics for this study are shown. Give notation for and find the difference in means. Variable Drink N Mean SE Mean StDev Minimum Median Q3 Maximum InterferonGamma Coffee 10 0 17 .70 5-28 16 . 69 0. 00 2.25 15 .50 25.25 52.00 Tea 11 34 . 82 5. 36 21 . 08 5.00 13.00 47 . 00 55.00 58 . 00 .do OCT 2 4 Aa
Step by Step Solution
There are 3 Steps involved in it

Get step-by-step solutions from verified subject matter experts