

Question: Box 1 x fox B D E F G H 1 O P P Q R S Comparing Projects (25 points) (1) Suppose you are
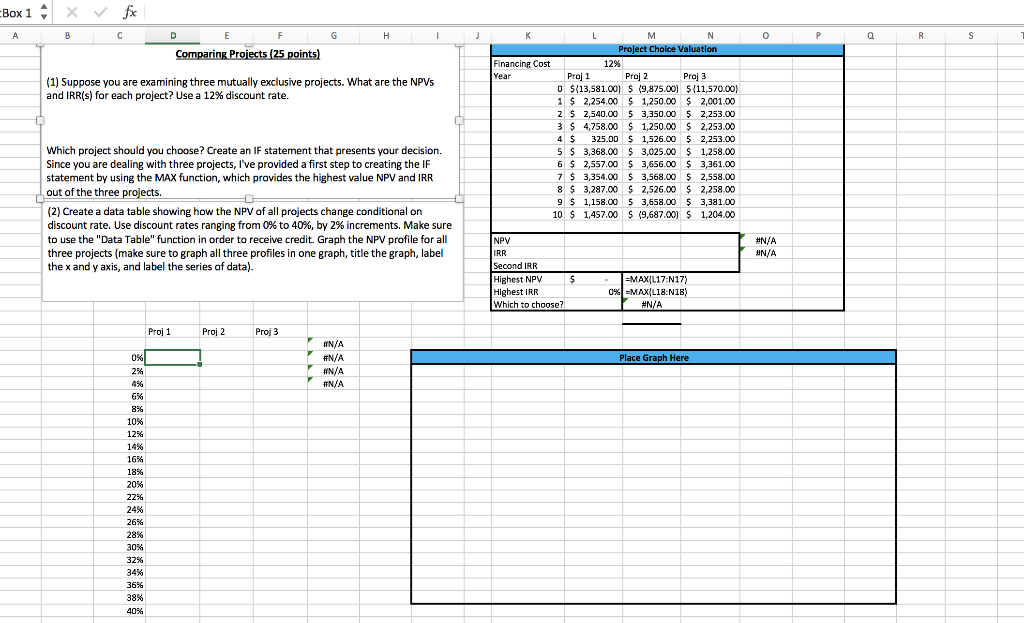
Box 1 x fox B D E F G H 1 O P P Q R S Comparing Projects (25 points) (1) Suppose you are examining three mutually exclusive projects. What are the NPVS and IRR(s) for each project? Use a 12% discount rate. K K L M N Project Cholce Valuation Financing Cost 12% Year Proj 1 Proj 2 Proj 3 0 $(13,581.00) $ (9,875.00) $(11,570.00) 1 $ 2,254.00 $1,250.00 $ 2.001.00 2 $ 2,540.00 $ 3,350.00 $ 2,253.00 3 $ 4,758.00 $ 1,250.00 $ 2,253.00 4 $ 325.00 $ 1,526.00 $ 2,253.00 5 $ 3,368.00 $ 3,025.00 $ 1,258.00 6 $ 2,557.00 $ 3,656.00 $ 3,361.00 7 $ 3,354.00 $ 3,568.00 $ 2,558.00 8 $ 3,287.00 $ 2,526.00 $ 2,258.00 9 $ 1,158.00 $ 3,658.00 $3,381.00 10 S 1,457.00 $ 19,687.00) $ 1,204.00 Which project should you choose? Create an IF statement that presents your decision. Since you are dealing with three projects, I've provided a first step to creating the IF statement by using the MAX function, which provides the highest value NPV and IRR out of the three projects. (2) Create a data table showing how the NPV of all projects change conditional on discount rate. Use discount rates ranging from 0% to 40%, by 2% increments. Make sure to use the "Data Table" function in order to receive credit. Graph the NPV profile for all three projects (make sure to graph all three profiles in one graph, title the graph, label the x and y axis, and label the series of data). #N/A N #N/A NPV IRR Second IRR Highest NPV Highest IRR Which to choose? $ =MAX(L17:N17) 0% =MAX/L18:N18) #N/A Proj 1 Proj 2 Proj 3 3 Place Graph Here 0% % 2% #N/A #N/A #N/A #N/A 8% 10% 12% 14% 16% 1896 20% 2294 24% 26% 28% 30% 32% 34% 36% 38% 40% Box 1 x fox B D E F G H 1 O P P Q R S Comparing Projects (25 points) (1) Suppose you are examining three mutually exclusive projects. What are the NPVS and IRR(s) for each project? Use a 12% discount rate. K K L M N Project Cholce Valuation Financing Cost 12% Year Proj 1 Proj 2 Proj 3 0 $(13,581.00) $ (9,875.00) $(11,570.00) 1 $ 2,254.00 $1,250.00 $ 2.001.00 2 $ 2,540.00 $ 3,350.00 $ 2,253.00 3 $ 4,758.00 $ 1,250.00 $ 2,253.00 4 $ 325.00 $ 1,526.00 $ 2,253.00 5 $ 3,368.00 $ 3,025.00 $ 1,258.00 6 $ 2,557.00 $ 3,656.00 $ 3,361.00 7 $ 3,354.00 $ 3,568.00 $ 2,558.00 8 $ 3,287.00 $ 2,526.00 $ 2,258.00 9 $ 1,158.00 $ 3,658.00 $3,381.00 10 S 1,457.00 $ 19,687.00) $ 1,204.00 Which project should you choose? Create an IF statement that presents your decision. Since you are dealing with three projects, I've provided a first step to creating the IF statement by using the MAX function, which provides the highest value NPV and IRR out of the three projects. (2) Create a data table showing how the NPV of all projects change conditional on discount rate. Use discount rates ranging from 0% to 40%, by 2% increments. Make sure to use the "Data Table" function in order to receive credit. Graph the NPV profile for all three projects (make sure to graph all three profiles in one graph, title the graph, label the x and y axis, and label the series of data). #N/A N #N/A NPV IRR Second IRR Highest NPV Highest IRR Which to choose? $ =MAX(L17:N17) 0% =MAX/L18:N18) #N/A Proj 1 Proj 2 Proj 3 3 Place Graph Here 0% % 2% #N/A #N/A #N/A #N/A 8% 10% 12% 14% 16% 1896 20% 2294 24% 26% 28% 30% 32% 34% 36% 38% 40%
Step by Step Solution
There are 3 Steps involved in it

Get step-by-step solutions from verified subject matter experts