

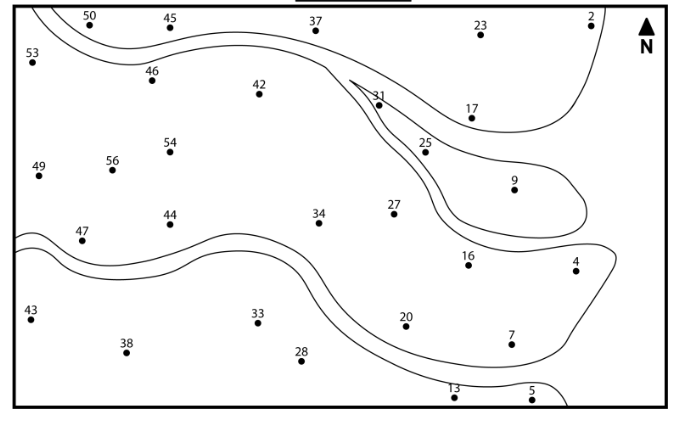
Question: Build your own contour map. Use the elevation data to make your own contour map from the data in Figure 2 . 9 . The
Build your own contour map. Use the elevation data to make your own contour map from the data in Figure The contour interval will be m The zerocontour interval is at sea level; so you dont need to draw that one! You may have to interpolate and extrapolate the data as there are very few data points that are m intervals. Remember how the contour intervals should look around the small streams and rivers. Draw your contour lines so that they are continuous: they will either continue to the edge of the map or form an enclosed circle.
Step by Step Solution
There are 3 Steps involved in it
1 Expert Approved Answer
Step: 1 Unlock

Question Has Been Solved by an Expert!
Get step-by-step solutions from verified subject matter experts
Step: 2 Unlock
Step: 3 Unlock