

Question: Calculate Piecewise Function and its Visualization 0 solutions submitted ( max: Unlimited ) Write a MATLAB program to evaluate and plot the piecewise function f
Calculate Piecewise Function and its Visualization
solutions submitted max: Unlimited
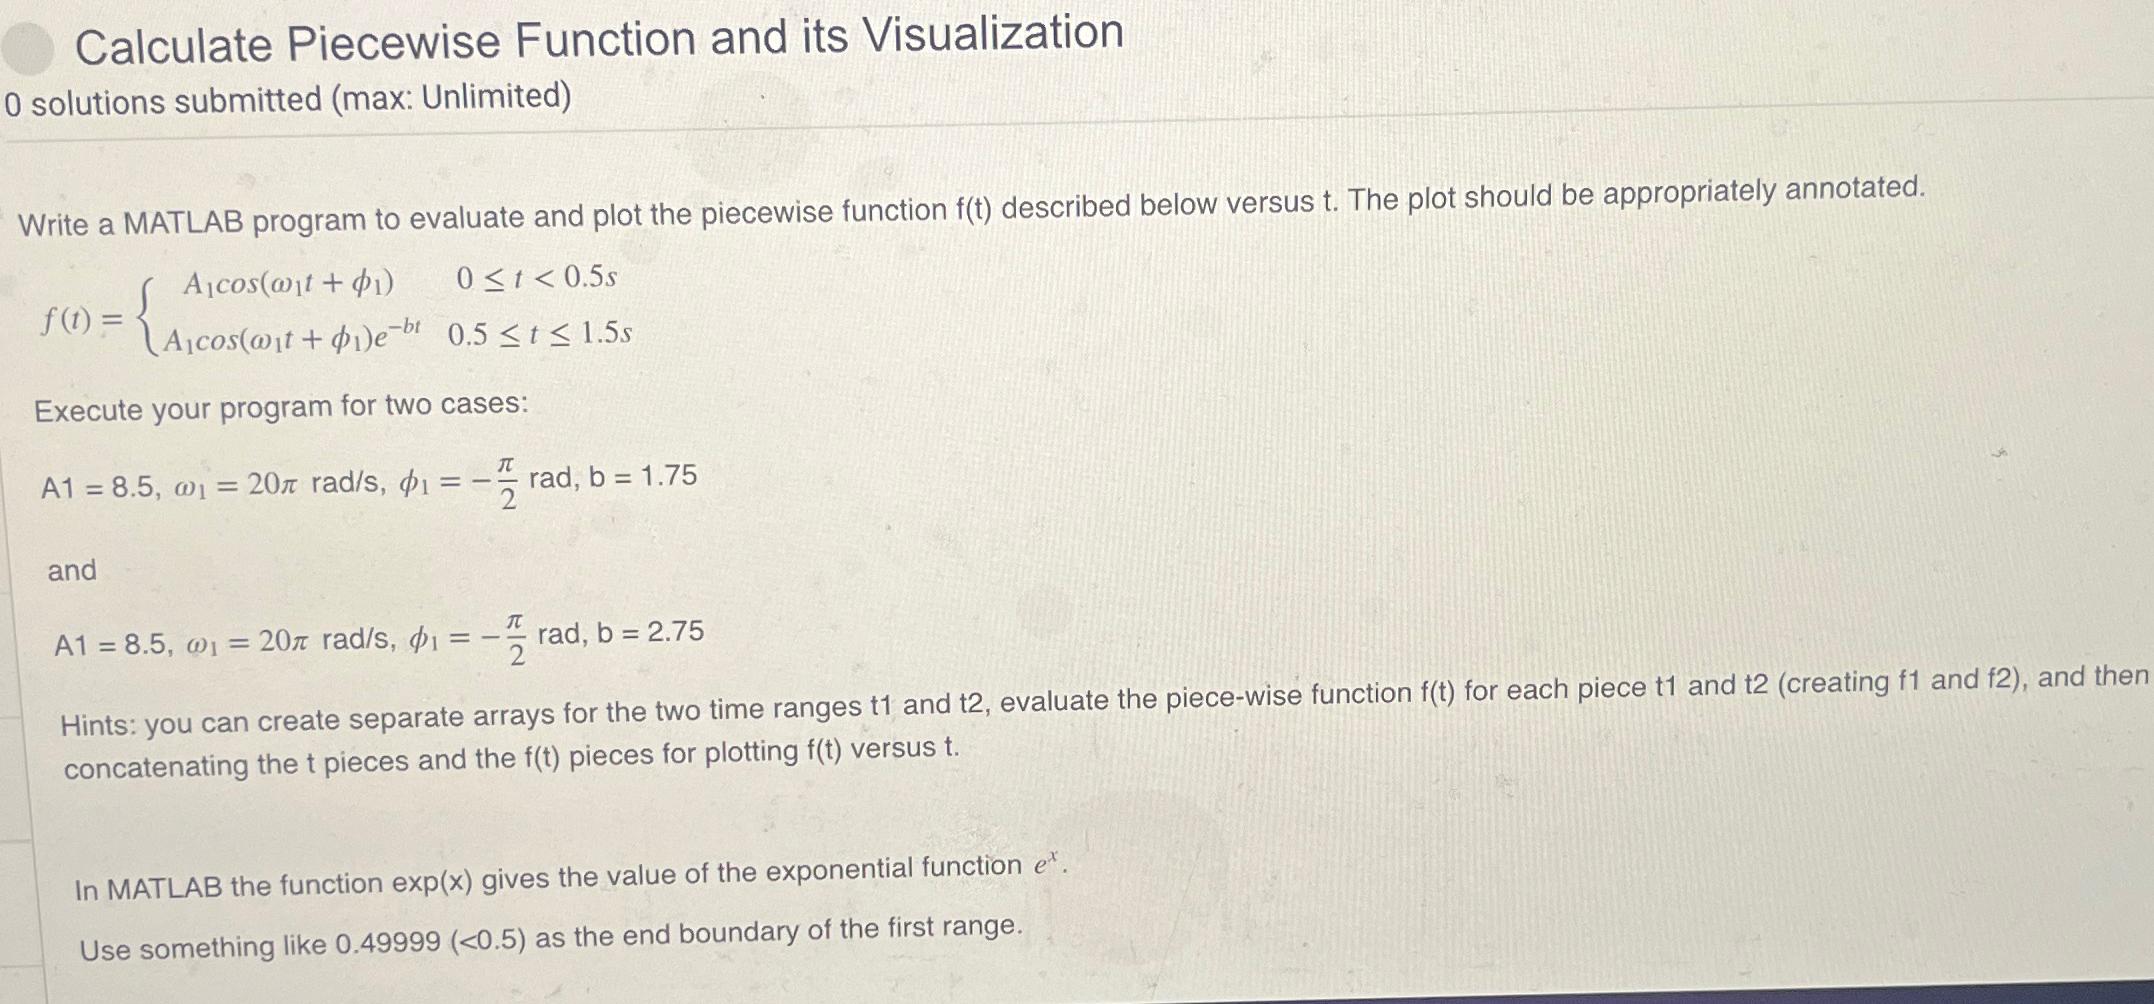
Write a MATLAB program to evaluate and plot the piecewise function described below versus The plot should be appropriately annotated.
Execute your program for two cases:
rad,
and
rad,
Hints: you can create separate arrays for the two time ranges and evaluate the piecewise function for each piece and creating and and then concatenating the pieces and the pieces for plotting versus
In MATLAB the function exp gives the value of the exponential function
Use something like as the end boundary of the first range.
Step by Step Solution
There are 3 Steps involved in it
1 Expert Approved Answer
Step: 1 Unlock

Question Has Been Solved by an Expert!
Get step-by-step solutions from verified subject matter experts
Step: 2 Unlock
Step: 3 Unlock