

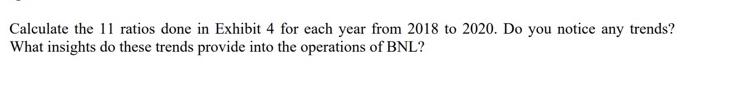
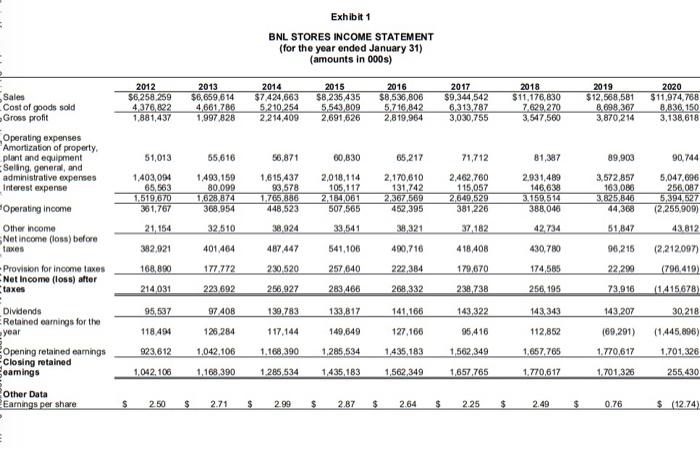
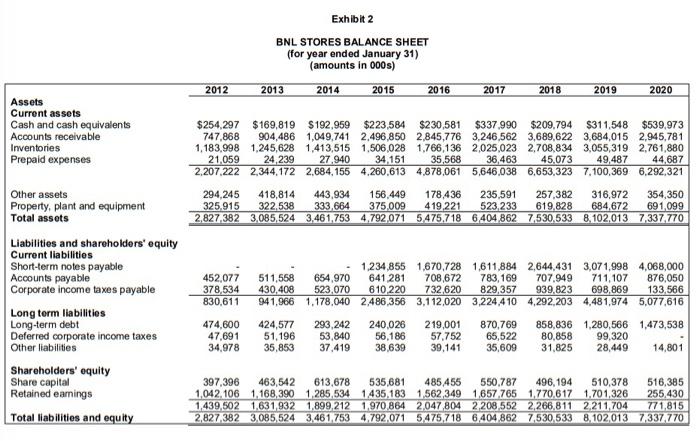
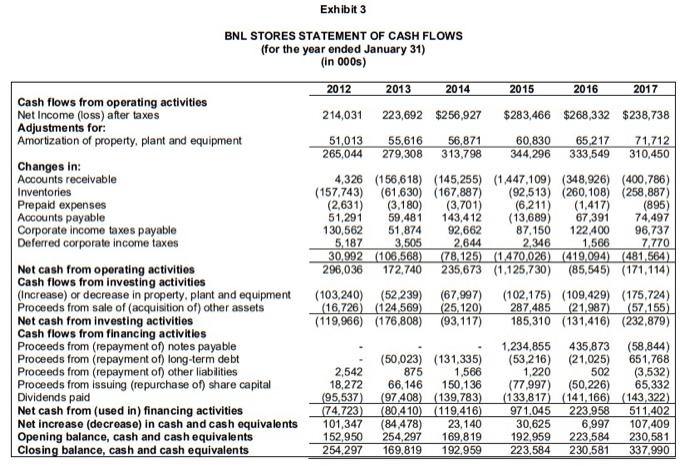
Calculate the 11 ratios done in Exhibit 4 for each year from 2018 to 2020. Do...
Fantastic news! We've Found the answer you've been seeking!
Question:
Transcribed Image Text:
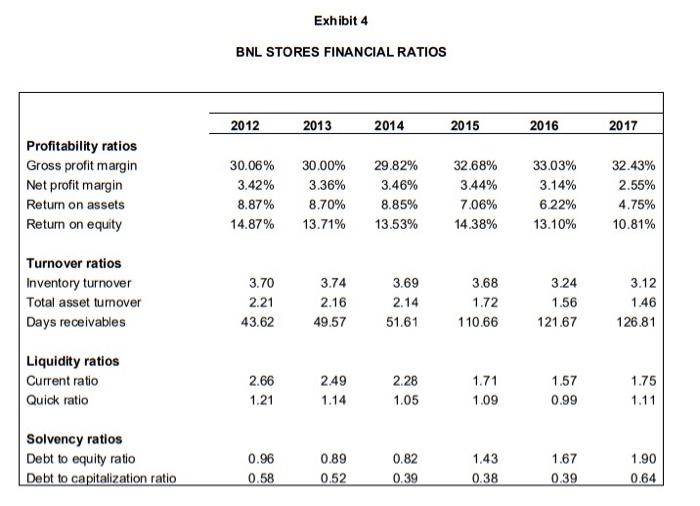
Calculate the 11 ratios done in Exhibit 4 for each year from 2018 to 2020. Do you notice any trends? What insights do these trends provide into the operations of BNL? Exhibit 1 BNL STORES INCOME STATEMENT (for the year ended January 31) (amounts in 000s) 2012 $6,258.259 4,376,822 1,881,437 2013 $6,659,614 4,661,786 1,997,828 2014 $7.424,663 5,210,254 2.214,409 2015 $8,235,435 5,543 809 2,691,626 2016 $8,536,806 5.716 842 2,819,964 2017 $9.344,542 Sales Cost of goods sold Gross profit 2018 $11,176,830 7.629,270 3,547,560 2019 $12,568,581 8.098.367 3,870,214 2020 $11,974,768 8.836,150 3,138,618 6,313,787 3,030,755 Operating expenses Amortization of property. plant and equipment Seling, general, and administrative expenses Interest expense 51,013 55,616 56,871 60,830 65,217 71,712 81,387 89,903 90,744 1,403,094 65,563 1,519,670 361,767 1,493,159 80.099 1,628 874 368,954 1,615,437 93,578 1,765,886 448,523 2,018,114 105,117 2,184,061 507,565 2,170,610 131,742 2,367,569 452,395 2,462,760 115,057 2,649,529 381,226 2.931,489 146,638 3.159.514 388,046 3,572,857 163,086 3,825,846 44,368 5,047,696 256,087 5,394,527 (2,255.909) Operating income Other income 21,154 32.510 38.924 33,541 38,321 37 182 42,734 51,847 43.812 Net income (loss) before taxes 382,921 401,464 487,447 541,106 490,716 418,408 430,780 96,215 (2,212.007) 168,890 177.772 230,520 257640 22,299 (796.419) Provision for income taxes Net Income (loss) after taxes 222,384 179,670 174,585 214.031 223 692 256,927 283,466 268 332 238,738 256, 195 73,916 (1415678) Dividends ERetained earnings for the year Opening retained eamings Closing retained eamings 95,537 97 408 139,783 133,817 141,166 143,322 143,343 143,207 30,218 118,494 126.284 117,144 149,649 127,166 95,416 112,852 (69,291) (1,445.896) 923,612 1,042.106 1.168,390 1,285,534 1,435,183 1,562,349 1,657,765 1.770,617 1,701.326 1,042, 106 1,168,390 1.285,534 1,435,183 1,562,349 1,657,765 1,770,617 1,701,326 255,430 Other Data Earnings per share 2.50 2.71 2.99 2.87 2.64 2.25 2.49 0.76 $ 12.74) Exhibit 2 BNL STORES BALANCE SHEET (for year ended January 31) (amounts in 000s) 2012 2013 2014 2015 2016 2017 2018 2019 2020 Assets Current assets Cash and cash equivalents Accounts receivable Inventories $539,973 904,486 1,049,741 2,496,850 2,845,776 3,246,562 3,689,622 3,684,015 2,945,781 1,183,998 1,245,628 1,413,515 1,506,028 1,766,136 2,025,023 2,708,834 3,055,319 2,761,880 44,687 2,207,222 2,344,172 2,684,155 4,260,613 4,878,061 5,646,038 6,653,323 7,100,369 6,292,321 $254,297 $169,819 $192,959 $223,584 747,868 $230,581 $337,990 $209,794 $311,548 Prepaid expenses 21,059 24,239 27,940 34,151 35,568 36,463 45.073 49,487 294,245 325.915 235,591 523,233 Other assets Property, plant and equipment Total assets 178,436 419,221 2,827,382 3,085,524 3,461,753 4,792,071 5,475,718 6,404,862 7,530,533 8,102,013 7,337,770 418,814 322,538 443,934 333,664 156,449 375,009 257,382 619,828 316,972 684,672 354,350 691,099 Liabilities and shareholders' equity Current liabilities Short-term notes payable Accounts payable Corporate income taxes payable 1,234,855 1,670,728 1,611,884 2,644,431 3,071,998 4,068,000 641,281 610,220 452,077 378,534 830,611 708,672 783,169 732,620 829,357 941,966 1,178,040 2,486,356 3,112,020 3,224 4 10 4,292,203 4,481,974 5,077,616 511,558 430,408 654,970 523,070 707.949 711,107 698,869 876,050 133,566 939,823 Long term liabilities Long-term debt Deferred corporate income taxes Other liabilities 474,600 47,691 34,978 424,577 51,196 35,853 293,242 53,840 37,419 240,026 56,186 38,639 219,001 57,752 39,141 870,769 65,522 35,609 858,836 1,280,566 1,473,538 80,858 31,825 99,320 28,449 14,801 Shareholders' equity Share capital Retained eanings 397,396 463,542 613,678 535,681 485,455 550,787 496, 194 510,378 516,385 1,042,106 1,168,390 1,285,534 1435,183 1,562,349 1,657.765 1,770.617 1,701,326 1,439,502 1,631,932 1,899,212 1,970,864 2,047,804 2,208 552 2,266,811 2,211,704 2,827,382 3.085,524 3,461,753 4,792.071 5475,718 6,404.862 7,530,533 8,102,013 7,337,770 255,430 771,815 Total liabilitios and equity Exhibit 3 BNL STORES STATEMENT OF CASH FLOWS (for the year ended January 31) (in 000s) 2012 2013 2014 2015 2016 2017 Cash flows from operating activities Net Income (loss) after taxes Adjustments for: Amortization of property, plant and equipment 214,031 223,692 $256,927 $283,466 $268,332 $238,738 51,013 265,044 55,616 279,308 56,871 313,798 60,830 344,296 65,217 333,549 71,712 310,450 Changes in: Accounts receivable 4,326 (156,618) (145,255) (1,447,109) (348,926) (400,786) (157,743) (61,630) (167,887) (2,631) 51,291 130,562 5,187 30,992 (106,568) 296,036 (92,513) (260,108) (258.887) (895) 74,497 96,737 7,770 (78,125) (1.470,026) (419,094) (481,564) 235,673 (1,125,730) (85,545) (171,114) Inventories (3,180) 59,481 51,874 3,505 (3.701) Prepaid expenses Accounts payable Corporate income taxes payable Deferred corporate income taxes (6.211) (13,689) 87, 150 2,346 (1,417) 67,391 122,400 1,566 143,4 12 92,662 2,644 Net cash from operating activities Cash flows from investing activities (Increase) or decrease in property, plant and equipment Proceeds from sale of (acquisition of) other assets Net cash from investing activities Cash flows from financing activities Proceeds from (repayment of) notes payable Proceeds from (repayment of) long-term debt Proceeds from (repayment of) other liabilities Proceeds from issuing (repurchase of) share capital Dividends paid Net cash from (used in) financing activities Net increase (decrease) in cash and cash equivalents Opening balance, cash and cash equivalents Closing balance, cash and cash equivalents 172,740 (103,240) (52,239) (16,726) (124,569) (119,966) (176,808) (93,117) (67,997) (25,120) (102,175) (109,429) (175,724) 287,485 185,310 (131,416) (232,879) (21,987) (57,155) (58,844) 651,768 (3,532) 65,332 (133,817) (141,166) (143,322) 511.402 107,409 230,581 337,990 1,234,855 435,873 (53,216) (21,025) 1,220 (77,997) (50,226) (50,023) (131,335) 875 2,542 18,272 (95,537) (74.723) 101,347 152,950 254,297 1,566 502 150,136 66, 146 (97 408) (139,783) (80,410) (119,416) (84,478) 254,297 169,819 971,045 223,958 23,140 169,8 19 192,959 30,625 192,959 223,584 6,997 223,584 230,581 Exhibit 4 BNL STORES FINANCIAL RATIOS 2012 2013 2014 2015 2016 2017 Profitability ratios Gross profit margin Net profit margin Return on assets Return on equity 30.06% 30.00% 29.82% 32.68% 33.03% 32.43% 3.42% 3.36% 3.46% 3.44% 3.14% 2.55% 8.87% 8.70% 8.85% 7.06% 6.22% 4.75% 14.87% 13.71% 13.53% 14.38% 13.10% 10.81% Turnover ratios Inventory turnover Total asset tumover Days receivables 3.70 3.74 3.69 3.68 3.24 3.12 2.21 2.16 2.14 1.72 1.56 1.46 43.62 49.57 51.61 110.66 121.67 126.81 Liquidity ratios Current ratio 2.66 2.49 2.28 1.71 1.57 1.75 Quick ratio 1.21 1.14 1.05 1.09 0.99 1.11 Solvency ratios Debt to equity ratio 0.89 0.82 0.39 0.96 1.43 1.67 1.90 Debt to capitalization ratio 0.58 0.52 0.38 0.39 0.64 Calculate the 11 ratios done in Exhibit 4 for each year from 2018 to 2020. Do you notice any trends? What insights do these trends provide into the operations of BNL? Exhibit 1 BNL STORES INCOME STATEMENT (for the year ended January 31) (amounts in 000s) 2012 $6,258.259 4,376,822 1,881,437 2013 $6,659,614 4,661,786 1,997,828 2014 $7.424,663 5,210,254 2.214,409 2015 $8,235,435 5,543 809 2,691,626 2016 $8,536,806 5.716 842 2,819,964 2017 $9.344,542 Sales Cost of goods sold Gross profit 2018 $11,176,830 7.629,270 3,547,560 2019 $12,568,581 8.098.367 3,870,214 2020 $11,974,768 8.836,150 3,138,618 6,313,787 3,030,755 Operating expenses Amortization of property. plant and equipment Seling, general, and administrative expenses Interest expense 51,013 55,616 56,871 60,830 65,217 71,712 81,387 89,903 90,744 1,403,094 65,563 1,519,670 361,767 1,493,159 80.099 1,628 874 368,954 1,615,437 93,578 1,765,886 448,523 2,018,114 105,117 2,184,061 507,565 2,170,610 131,742 2,367,569 452,395 2,462,760 115,057 2,649,529 381,226 2.931,489 146,638 3.159.514 388,046 3,572,857 163,086 3,825,846 44,368 5,047,696 256,087 5,394,527 (2,255.909) Operating income Other income 21,154 32.510 38.924 33,541 38,321 37 182 42,734 51,847 43.812 Net income (loss) before taxes 382,921 401,464 487,447 541,106 490,716 418,408 430,780 96,215 (2,212.007) 168,890 177.772 230,520 257640 22,299 (796.419) Provision for income taxes Net Income (loss) after taxes 222,384 179,670 174,585 214.031 223 692 256,927 283,466 268 332 238,738 256, 195 73,916 (1415678) Dividends ERetained earnings for the year Opening retained eamings Closing retained eamings 95,537 97 408 139,783 133,817 141,166 143,322 143,343 143,207 30,218 118,494 126.284 117,144 149,649 127,166 95,416 112,852 (69,291) (1,445.896) 923,612 1,042.106 1.168,390 1,285,534 1,435,183 1,562,349 1,657,765 1.770,617 1,701.326 1,042, 106 1,168,390 1.285,534 1,435,183 1,562,349 1,657,765 1,770,617 1,701,326 255,430 Other Data Earnings per share 2.50 2.71 2.99 2.87 2.64 2.25 2.49 0.76 $ 12.74) Exhibit 2 BNL STORES BALANCE SHEET (for year ended January 31) (amounts in 000s) 2012 2013 2014 2015 2016 2017 2018 2019 2020 Assets Current assets Cash and cash equivalents Accounts receivable Inventories $539,973 904,486 1,049,741 2,496,850 2,845,776 3,246,562 3,689,622 3,684,015 2,945,781 1,183,998 1,245,628 1,413,515 1,506,028 1,766,136 2,025,023 2,708,834 3,055,319 2,761,880 44,687 2,207,222 2,344,172 2,684,155 4,260,613 4,878,061 5,646,038 6,653,323 7,100,369 6,292,321 $254,297 $169,819 $192,959 $223,584 747,868 $230,581 $337,990 $209,794 $311,548 Prepaid expenses 21,059 24,239 27,940 34,151 35,568 36,463 45.073 49,487 294,245 325.915 235,591 523,233 Other assets Property, plant and equipment Total assets 178,436 419,221 2,827,382 3,085,524 3,461,753 4,792,071 5,475,718 6,404,862 7,530,533 8,102,013 7,337,770 418,814 322,538 443,934 333,664 156,449 375,009 257,382 619,828 316,972 684,672 354,350 691,099 Liabilities and shareholders' equity Current liabilities Short-term notes payable Accounts payable Corporate income taxes payable 1,234,855 1,670,728 1,611,884 2,644,431 3,071,998 4,068,000 641,281 610,220 452,077 378,534 830,611 708,672 783,169 732,620 829,357 941,966 1,178,040 2,486,356 3,112,020 3,224 4 10 4,292,203 4,481,974 5,077,616 511,558 430,408 654,970 523,070 707.949 711,107 698,869 876,050 133,566 939,823 Long term liabilities Long-term debt Deferred corporate income taxes Other liabilities 474,600 47,691 34,978 424,577 51,196 35,853 293,242 53,840 37,419 240,026 56,186 38,639 219,001 57,752 39,141 870,769 65,522 35,609 858,836 1,280,566 1,473,538 80,858 31,825 99,320 28,449 14,801 Shareholders' equity Share capital Retained eanings 397,396 463,542 613,678 535,681 485,455 550,787 496, 194 510,378 516,385 1,042,106 1,168,390 1,285,534 1435,183 1,562,349 1,657.765 1,770.617 1,701,326 1,439,502 1,631,932 1,899,212 1,970,864 2,047,804 2,208 552 2,266,811 2,211,704 2,827,382 3.085,524 3,461,753 4,792.071 5475,718 6,404.862 7,530,533 8,102,013 7,337,770 255,430 771,815 Total liabilitios and equity Exhibit 3 BNL STORES STATEMENT OF CASH FLOWS (for the year ended January 31) (in 000s) 2012 2013 2014 2015 2016 2017 Cash flows from operating activities Net Income (loss) after taxes Adjustments for: Amortization of property, plant and equipment 214,031 223,692 $256,927 $283,466 $268,332 $238,738 51,013 265,044 55,616 279,308 56,871 313,798 60,830 344,296 65,217 333,549 71,712 310,450 Changes in: Accounts receivable 4,326 (156,618) (145,255) (1,447,109) (348,926) (400,786) (157,743) (61,630) (167,887) (2,631) 51,291 130,562 5,187 30,992 (106,568) 296,036 (92,513) (260,108) (258.887) (895) 74,497 96,737 7,770 (78,125) (1.470,026) (419,094) (481,564) 235,673 (1,125,730) (85,545) (171,114) Inventories (3,180) 59,481 51,874 3,505 (3.701) Prepaid expenses Accounts payable Corporate income taxes payable Deferred corporate income taxes (6.211) (13,689) 87, 150 2,346 (1,417) 67,391 122,400 1,566 143,4 12 92,662 2,644 Net cash from operating activities Cash flows from investing activities (Increase) or decrease in property, plant and equipment Proceeds from sale of (acquisition of) other assets Net cash from investing activities Cash flows from financing activities Proceeds from (repayment of) notes payable Proceeds from (repayment of) long-term debt Proceeds from (repayment of) other liabilities Proceeds from issuing (repurchase of) share capital Dividends paid Net cash from (used in) financing activities Net increase (decrease) in cash and cash equivalents Opening balance, cash and cash equivalents Closing balance, cash and cash equivalents 172,740 (103,240) (52,239) (16,726) (124,569) (119,966) (176,808) (93,117) (67,997) (25,120) (102,175) (109,429) (175,724) 287,485 185,310 (131,416) (232,879) (21,987) (57,155) (58,844) 651,768 (3,532) 65,332 (133,817) (141,166) (143,322) 511.402 107,409 230,581 337,990 1,234,855 435,873 (53,216) (21,025) 1,220 (77,997) (50,226) (50,023) (131,335) 875 2,542 18,272 (95,537) (74.723) 101,347 152,950 254,297 1,566 502 150,136 66, 146 (97 408) (139,783) (80,410) (119,416) (84,478) 254,297 169,819 971,045 223,958 23,140 169,8 19 192,959 30,625 192,959 223,584 6,997 223,584 230,581 Exhibit 4 BNL STORES FINANCIAL RATIOS 2012 2013 2014 2015 2016 2017 Profitability ratios Gross profit margin Net profit margin Return on assets Return on equity 30.06% 30.00% 29.82% 32.68% 33.03% 32.43% 3.42% 3.36% 3.46% 3.44% 3.14% 2.55% 8.87% 8.70% 8.85% 7.06% 6.22% 4.75% 14.87% 13.71% 13.53% 14.38% 13.10% 10.81% Turnover ratios Inventory turnover Total asset tumover Days receivables 3.70 3.74 3.69 3.68 3.24 3.12 2.21 2.16 2.14 1.72 1.56 1.46 43.62 49.57 51.61 110.66 121.67 126.81 Liquidity ratios Current ratio 2.66 2.49 2.28 1.71 1.57 1.75 Quick ratio 1.21 1.14 1.05 1.09 0.99 1.11 Solvency ratios Debt to equity ratio 0.89 0.82 0.39 0.96 1.43 1.67 1.90 Debt to capitalization ratio 0.58 0.52 0.38 0.39 0.64
Expert Answer:
Answer rating: 100% (QA)
Profitability Ratios Gross Profit Margin Ratio Gross Profit Sales 2018 3174 2019 3079 2020 2621 Net ... View the full answer

Related Book For 

Financial Reporting Financial Statement Analysis and Valuation a strategic perspective
ISBN: 978-1337614689
9th edition
Authors: James M. Wahlen, Stephen P. Baginski, Mark Bradshaw
Posted Date:
Students also viewed these marketing questions
-
An object moving with uniform acceleration has a velocity of 13.0 cm/s in the positive x direction when its x coordinate is 3.30 cm. If its x coordinate 1.95 s later is -5.00 cm, what is its...
-
Do you notice any similarities between Carver's style of writing and Hemingway's? If so, explain.
-
OASIS HEALTH CARE INC Income Statement For the Month Ended January 31 20Y5 Revenues Fees earned 84900 Operating expenses Wages expense 25700 Utilities expense 6000 Rent expense 5000 Depreciation...
-
Julie Hernandez is single and has no dependents. She operates a dairy farm and her Social Security number is 000-00-1111. She lives at 1325 Vermont Street in Costa, Florida. Consider the following...
-
Use the following information and deter mine the carrying amount of the property, plant, and equipment of Manotick Inc. on December 31, 2017, the company's year-end. (An accounting equation...
-
At the given instant, the rod is spinning about the z axis with an angular velocity and angular acceleration ' 1 . At this same instant, the disk is spinning, with 2 and ' 2 both measured relative...
-
Robert Boyle (1627-1691) established the law that (pressure \(\times\) volume) \(=\) constant for a gas at a constant temperature. By pouring mercury into the open top of the long side of a...
-
Linda Madison owns Creations, a business that provides hair and nail care services in a small college town. Recently, Linda has decided to expand her business to include tanning and massage services...
-
Part 1 Kristen, 25 years old, started her first job out of training in the operating room (OR) at a local hospital. During the routine screenings for hire, it was discovered that Kristen was...
-
You are trying to prepare nancial statements for Bartlett Pickle Company, but seem to be missing its balance sheet. You have Bartletts income statement, which shows sales last year were $310 million...
-
Refer to the information in E17-3 and assume that Roosevelt elected the fair value option for this held-for-collection investment. Instructions (a) Prepare any entries necessary at December 31, 2015,...
-
Agassi Corporation is preparing the comparative financial statements to be included in the annual report to shareholders. Agassi employs a fiscal year ending May 31. Income before income tax for...
-
Kennedy Company had a defined benefit obligation of \($6\),300,000 and plan assets of \($4\),900,000 at January 1, 2015. Kennedy has the following data related to the plan during 2015. Defined...
-
Comparative Analysis Case British Airways and Air FranceKLM Instructions Go to the British Airways (GBR) and Air FranceKLM (FRA) (Air France) company websites and use information found there to...
-
Lyons Corporation is a medium-sized manufacturer of paperboard containers and boxes. The corporation sponsors a non-contributory, defined benefit pension plan that covers its 250 employees. Tim Shea...
-
You have a mortgage loan of $800,000 to be repaid over 25 years. What is the monthly instalment if interest rate is 4.5%? What is the interest paid in the second month? Assume an ordinary annuity and...
-
What are the two components of a company's income tax provision? What does each component represent about a company's income tax provision?
-
Priority Contractors provides maintenance and cleaning services to various corporate clients in New York City. The firm has provided the following forecasts of net income for Year +1 to Year +5: Year...
-
Firm A reports an increase in earnings per share; Firm B reports a decrease in earnings per share. Is this unconditionally informative about each firms performance? If not why is earnings per share...
-
Explain free cash flows. Describe which types of cash flows are free and which are not. How do free cash flows available for debt and equity stakeholders differ from free cash flows available for...
-
Consider the multiple linear regression model fit to the baseball data in Problem 3.41. Problem 3.41 Consider the 2016 major league baseball data in Table B.22. While team ERA was useful in...
-
Consider the simple linear regression model fit to the rental price data from Problem 2.36. Data From Problem 2.36 Table B.24 contains data on median family home rental price and other data for 51 US...
-
Consider the multiple linear regression model fit to the rental price data in Problem 3.42. Problem 3.42 Table B.24 contains data on median family home rental price and other data for 51 US cities....

Study smarter with the SolutionInn App