

Question: The overall average on a process you are attempting to monitor is 50.0 units. The process population standard deviation is 1.72 . Sample size is
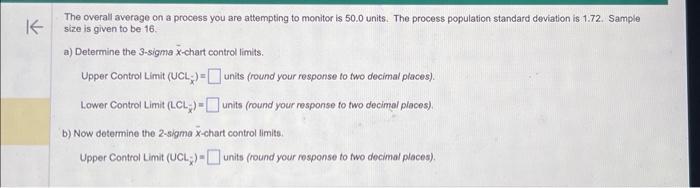
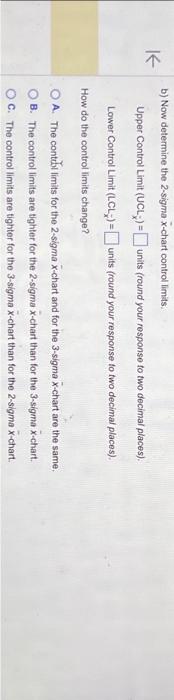
The overall average on a process you are attempting to monitor is 50.0 units. The process population standard deviation is 1.72 . Sample size is given to be 16 . a) Determine the 3 -sigma x-chart control limits. Upper Control Limit (UCL L)=units (round your response to two decimal places). Lower Control Limit (LCLx)= units (round your response to two decimal places) b) Now determine the 2-sigma x-chart control limita. Upper Control Limit (UCL ULx)= units (round your rosponse to two decimal places). b) Now determine the 2-sigma x-chart control limits: Upper Control Limit (UCL- )= units (round your response to two decimal places). Lower Control Limit (LCL)=units (round your response to two decimal places). How do the control limits change? A. The contubl limits for the 2 -sigma x-chart and for the 3 -sigma X-chart are the same. B. The control limits are tighter for the 2-sigma x-chart than for the 3 -sigma x-chart. c. The control limits are tighter for the 3 -sigma x-chart than for the 2 -sigma x-chart
Step by Step Solution
There are 3 Steps involved in it

Get step-by-step solutions from verified subject matter experts