

Question: calculate the UCL and LCL for thus data construct and submit a control chart. is the process stable ? DELOW. Number of Infections After Surgery
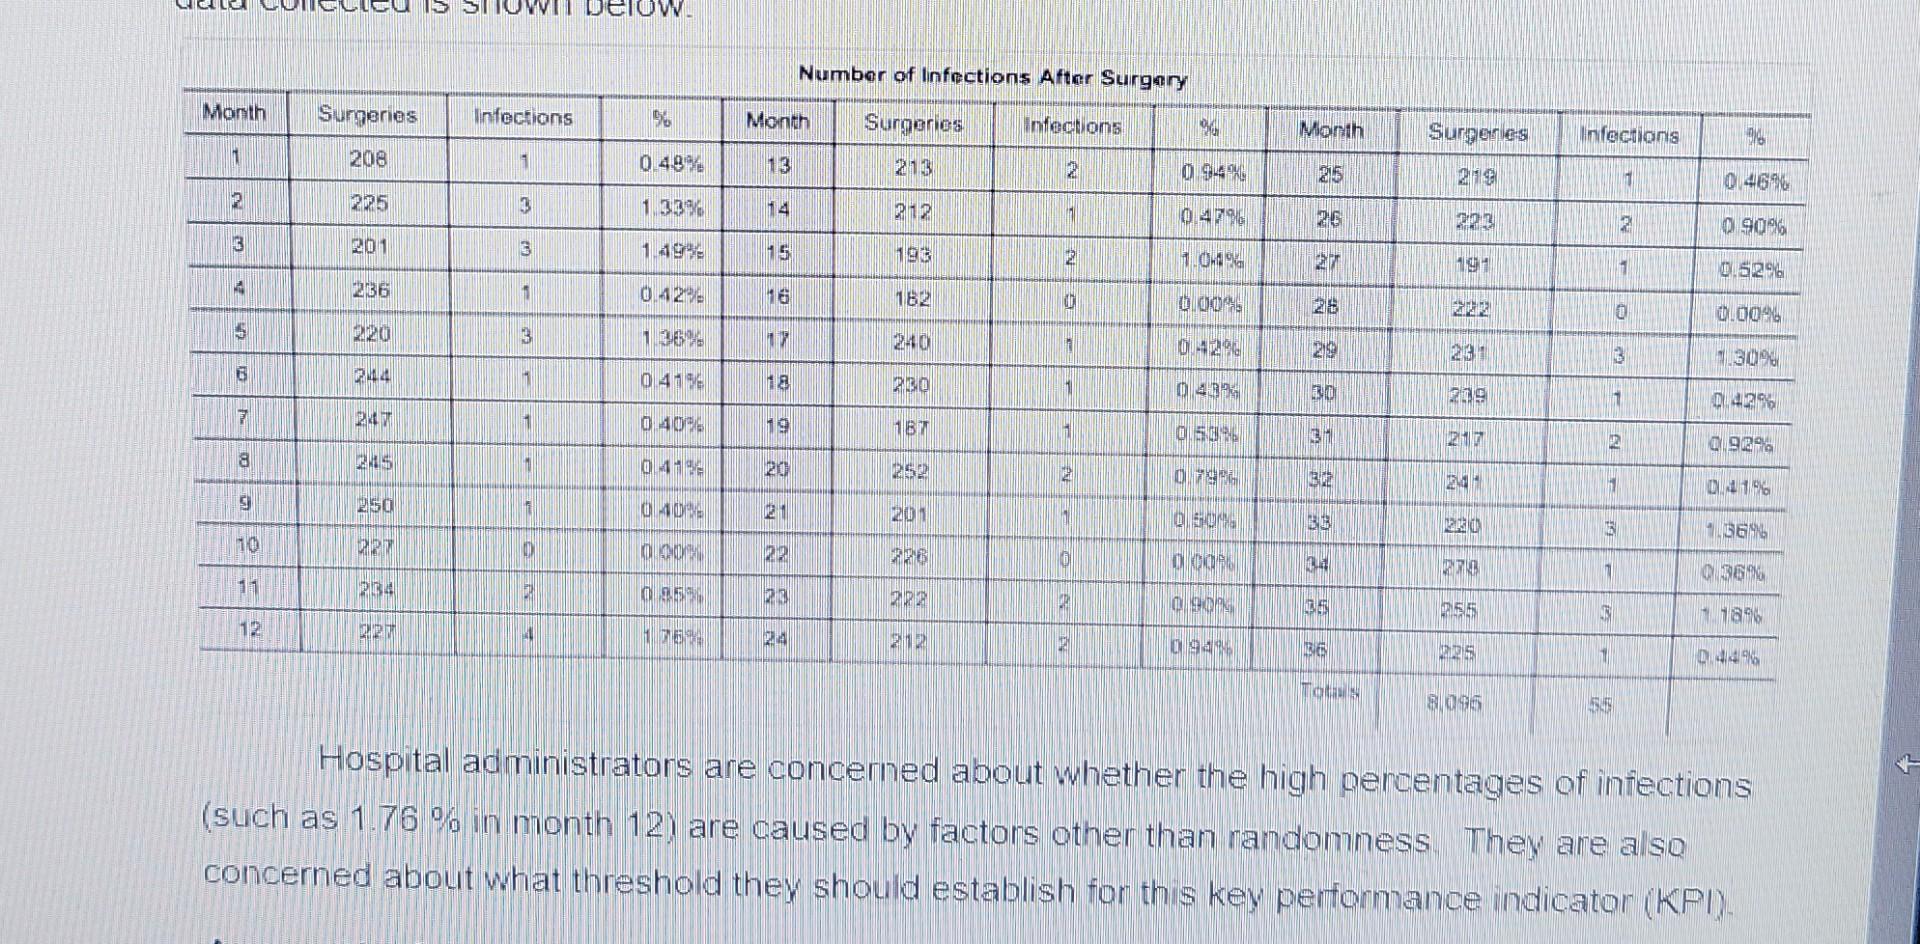
calculate the UCL and LCL for thus data construct and submit a control chart. is the process stable ?
DELOW. Number of Infections After Surgery Month Surgeries Infections 1976 Month Surgeries Inflections 90 Month Surgeries infections 190 1 208 1 0 4.99% 13 213 09-30 215 2018 1 0 46 2 225 3 1 339 14 212 25 02 2 0906 201 3 1.99 15 196 2 O. 27 19- 1 0.52% 206 1 0.429 162 0.0045 0.009 20 1 35 2-40 04296 219 B 30% 6. 244 1 0.41 18 280 1 0 43 20 209 1 0.42% 7 1 0407 19 1BT Ol. 5098 22 22 Q9B 8 US 1 04-19 20 OF 322 22 250 009 21 2011 O BE 12:30 13 666 10 22 0 00 22 226 0 DOC 2. 20 1 Q 21134 0915 232 WA 0 0 25 265 NO 1896 12 62 2.4 9 BE 2015 1 D46 To 096 59 Hospital administrators are concerned about whether the high percentages of infections (such as 1.76 % in month 12) are caused by factors other than randomness. They are also concerned about what threshold they should establish for this key performance indicator (KPI)Step by Step Solution
There are 3 Steps involved in it
1 Expert Approved Answer
Step: 1 Unlock

Question Has Been Solved by an Expert!
Get step-by-step solutions from verified subject matter experts
Step: 2 Unlock
Step: 3 Unlock