Question: Can someone explain this problem setp by step and please dont use excell!! I got these all wrong but I have no idea how to

Can someone explain this problem setp by step and please dont use excell!! I got these all wrong but I have no idea how to do this problem a walk through would be super helpful!Can someone explain this problem setp by step and

Mark Gershon, owner of a musical instrument distributorship, thinks that demand for guitars may be related to the number of television appearances by the popular group Maroon 5 during the previous month. Gershon has collected the data shown in the following table: 4 4 6 5 9 6 Maroon 5 TV Appearances Demand for Guitars 4 6 7 5 9 6 This exercise contains only parts b, c, and d. b) Using the least-squares regression method, the equation for forecasting is (round your responses to four decimal places): Y = 1.4809 + 0.8269 X c) The estimate for guitar sales if Maroon 5 performed on TV 11 times = 10.58 sales (round your response to two decimal places). d) The correlation coefficient (r) for this model = 0.8939 (round your response to four decimal places). The coefficient of determination (2) for this model = 0.7991 (round your response to four decimal places). The percentage of variation in sales that can be explained by TV appearances = 79.91 % (round your response to two decimal places)

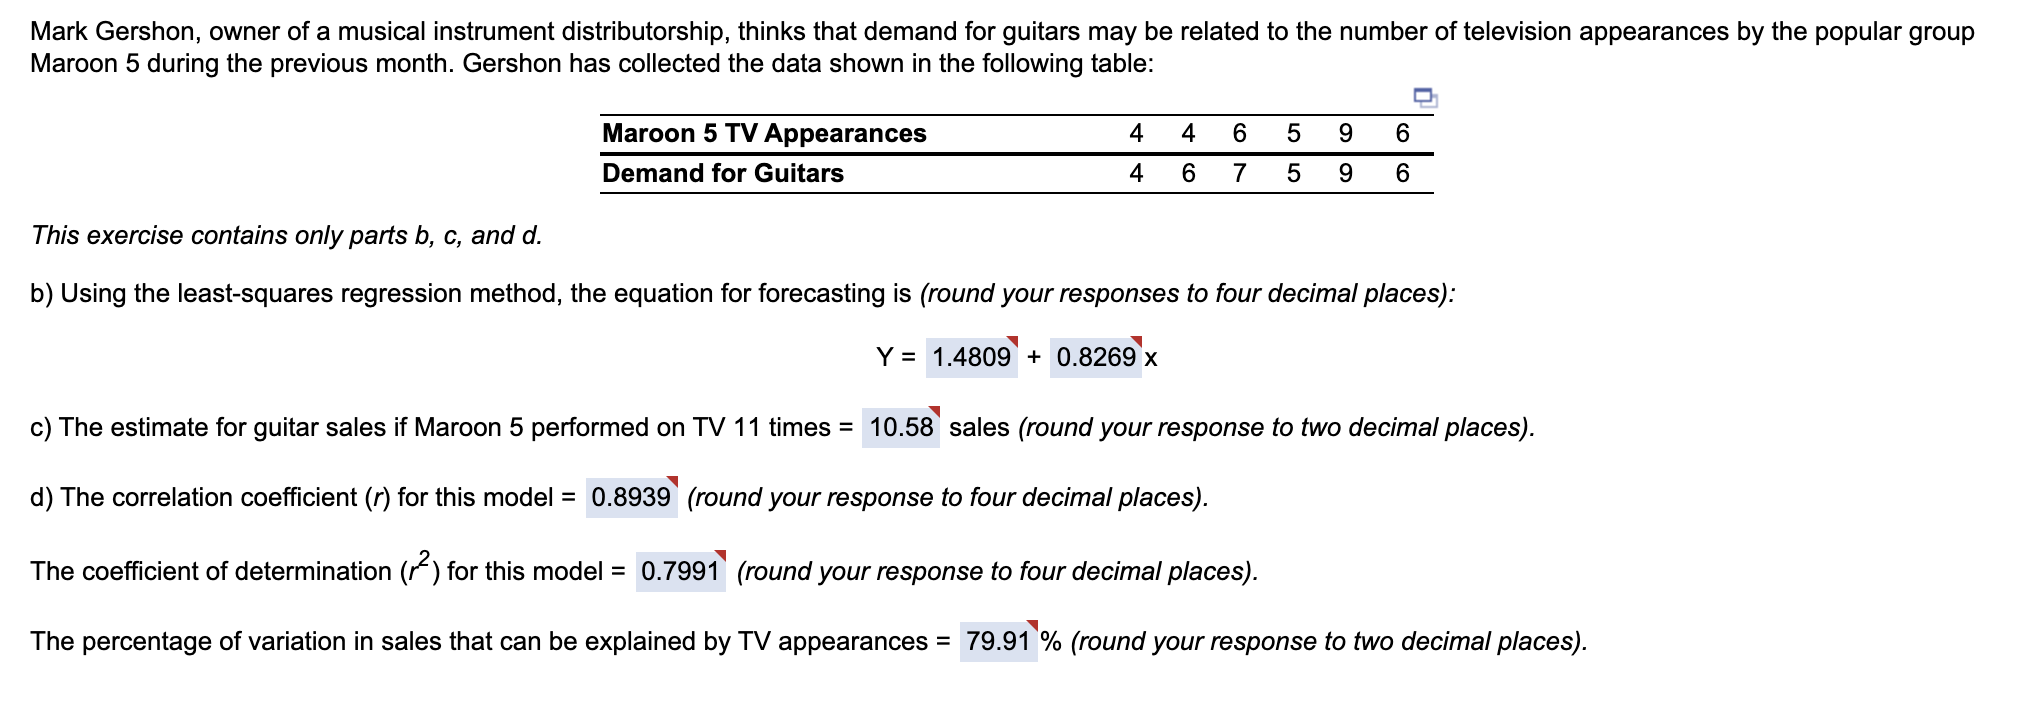
Step by Step Solution

There are 3 Steps involved in it

1 Expert Approved Answer
Step: 1 Unlock blur-text-image
Question Has Been Solved by an Expert!

Get step-by-step solutions from verified subject matter experts

Step: 2 Unlock
Step: 3 Unlock

Students Have Also Explored These Related General Management Questions!