

Question: Can someone help me draw this graph ? Angelo used a radar gun to take a sample of the speeds of cars on the road
Can someone help me draw this graph ?
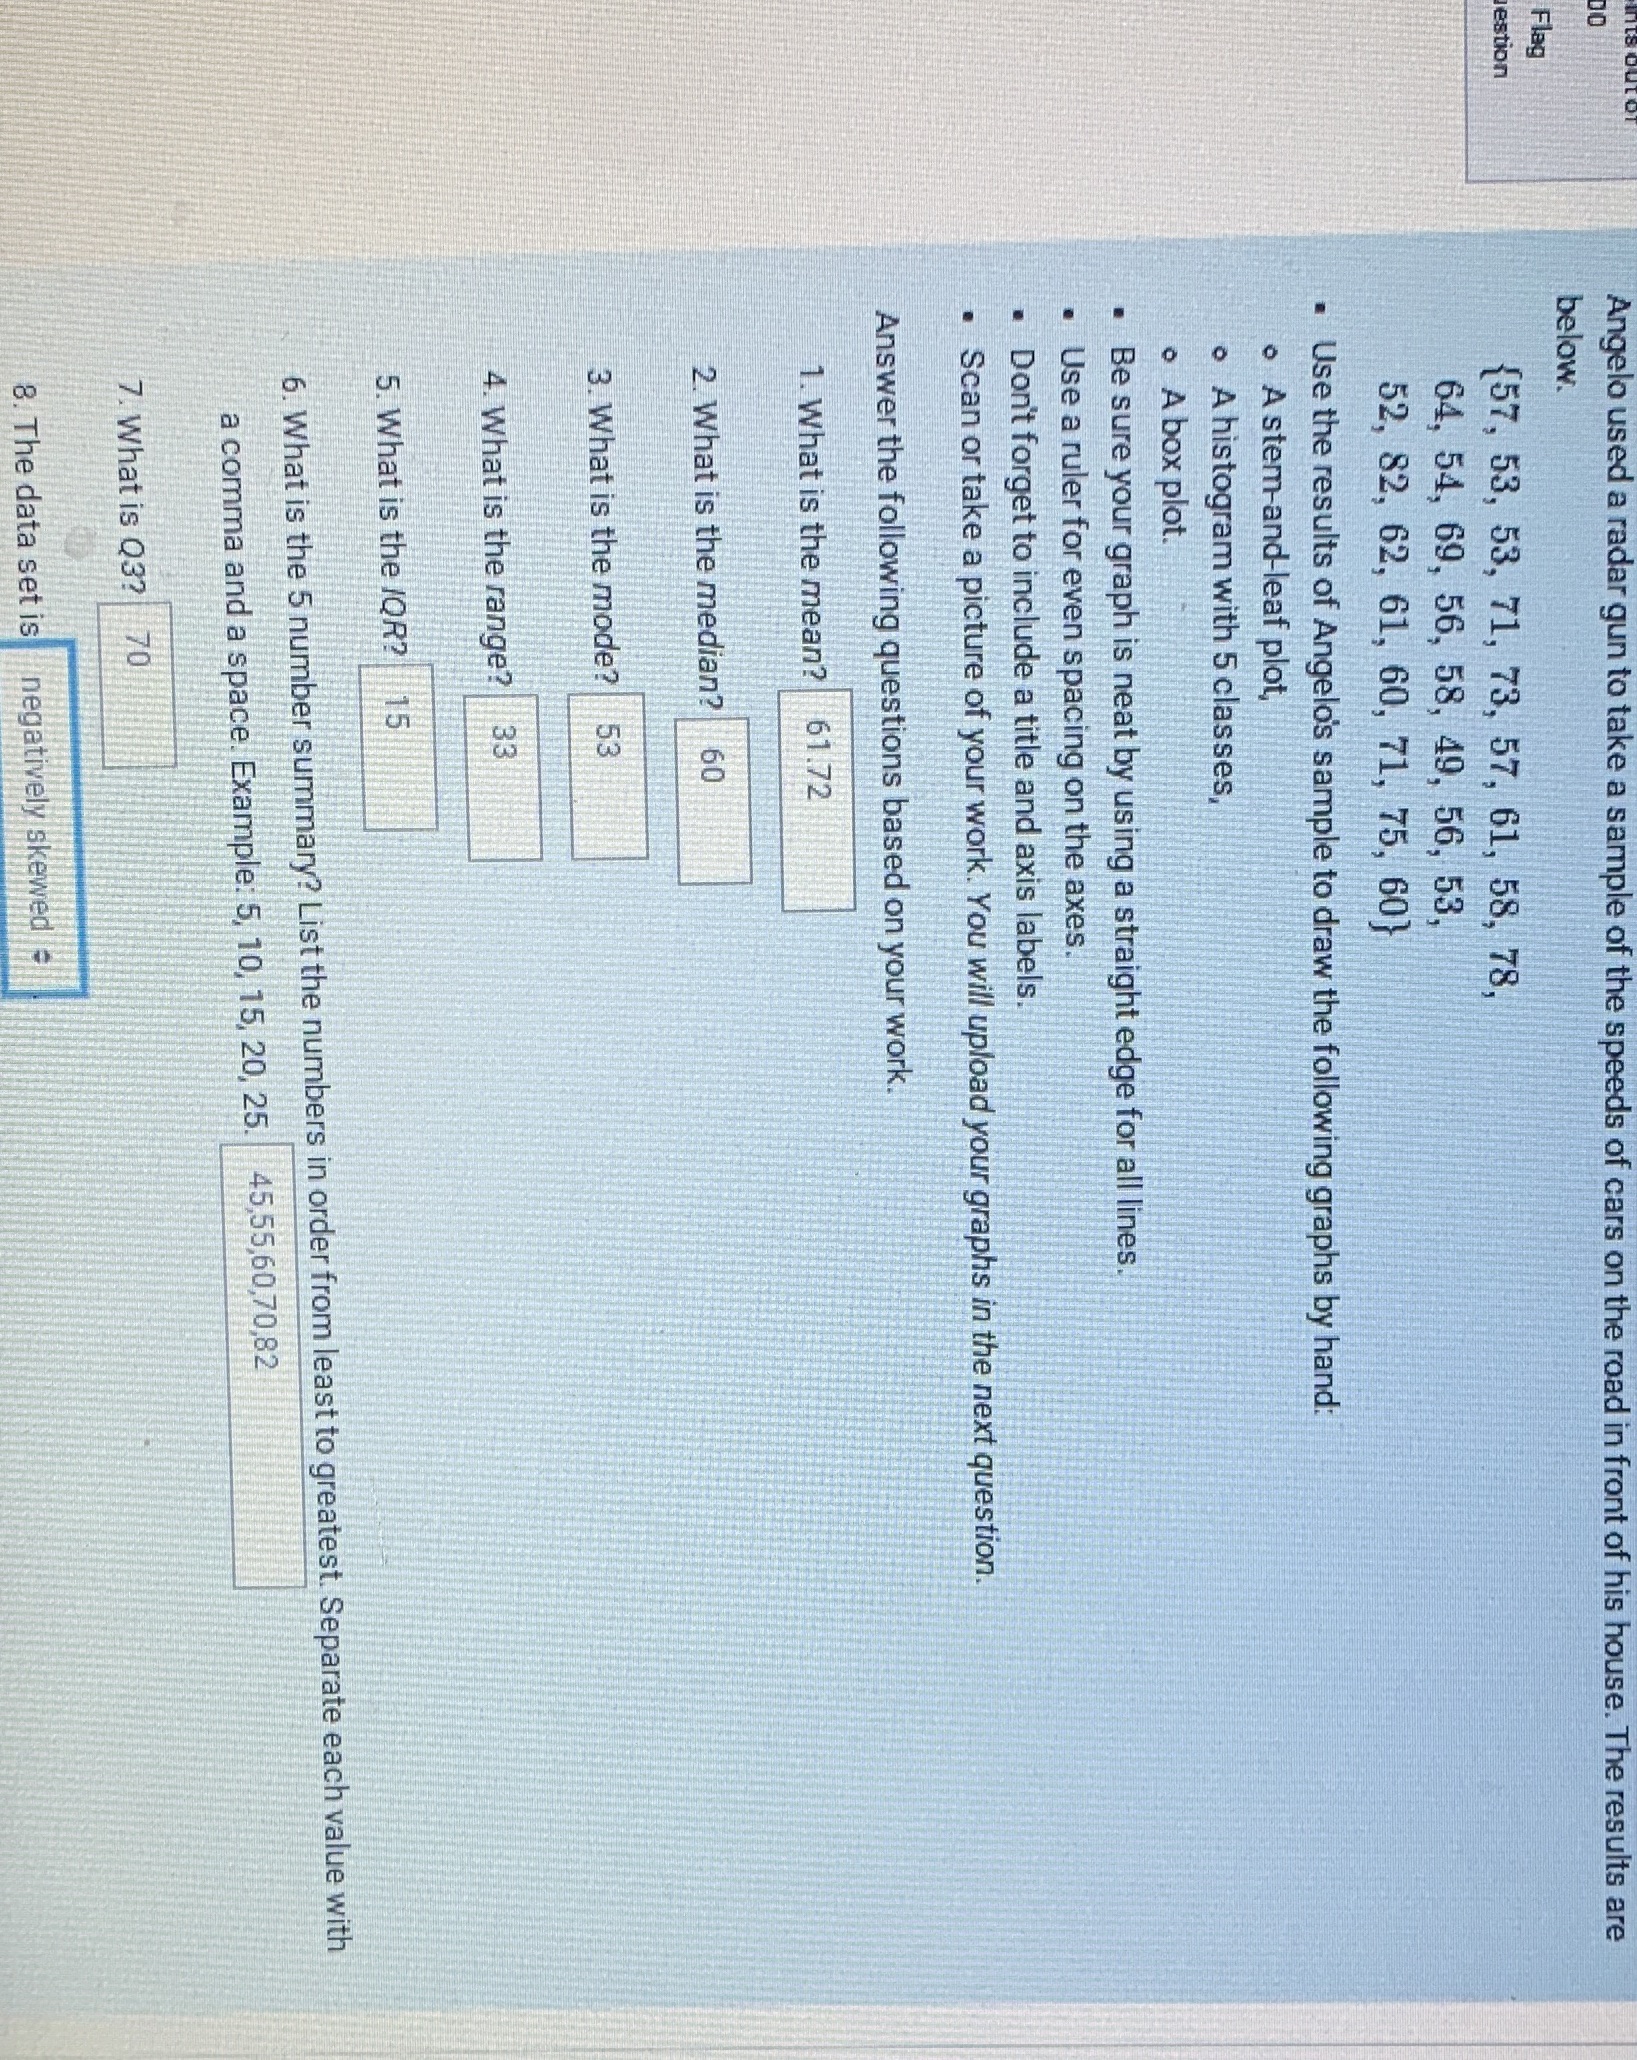
Angelo used a radar gun to take a sample of the speeds of cars on the road in front of his house. The results are below. Flag lestion (57, 53, 53, 71, 73, 57, 61, 58, 78, 64, 54, 69, 56, 58, 49, 56, 53, 52, 82, 62, 61, 60, 71, 75, 60} . Use the results of Angelo's sample to draw the following graphs by hand: . A stem-and-leaf plot, . A histogram with 5 classes, . A box plot. Be sure your graph is neat by using a straight edge for all lines. . Use a ruler for even spacing on the axes. . Don't forget to include a title and axis labels. . Scan or take a picture of your work. You will upload your graphs in the next question. Answer the following questions based on your work. 1. What is the mean? 61.72 2. What is the median? 3. What is the mode? 4. What is the range? 5. What is the IQR? 6. What is the 5 number summary? List the numbers in order from least to greatest. Separate each value with a comma and a space. Example: 5, 10, 15, 20, 25. | 45,55,60,70,82 7. What is Q3? 70 8. The data set is negatively skewed
Step by Step Solution
There are 3 Steps involved in it

Get step-by-step solutions from verified subject matter experts