

Question: Can someone please convert this data into a chart of actual sales and net income? B D Year Sales 2016 150,000 2017 173,500 2018 190,000
Can someone please convert this data into a chart of actual sales and net income?
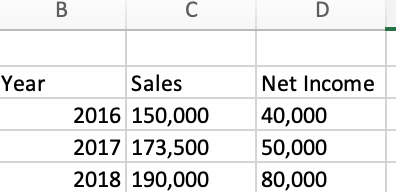
B D Year Sales 2016 150,000 2017 173,500 2018 190,000 Net Income 40,000 50,000 80,000
Step by Step Solution
There are 3 Steps involved in it
1 Expert Approved Answer
Step: 1 Unlock

Question Has Been Solved by an Expert!
Get step-by-step solutions from verified subject matter experts
Step: 2 Unlock
Step: 3 Unlock