

Question: Please explain the below chart in more than 1 page. (i.e.. ROE, Credit Rating, Image Rating, Net Revenue, Net Profit, Earnings Per Share, Action-Capture Camera
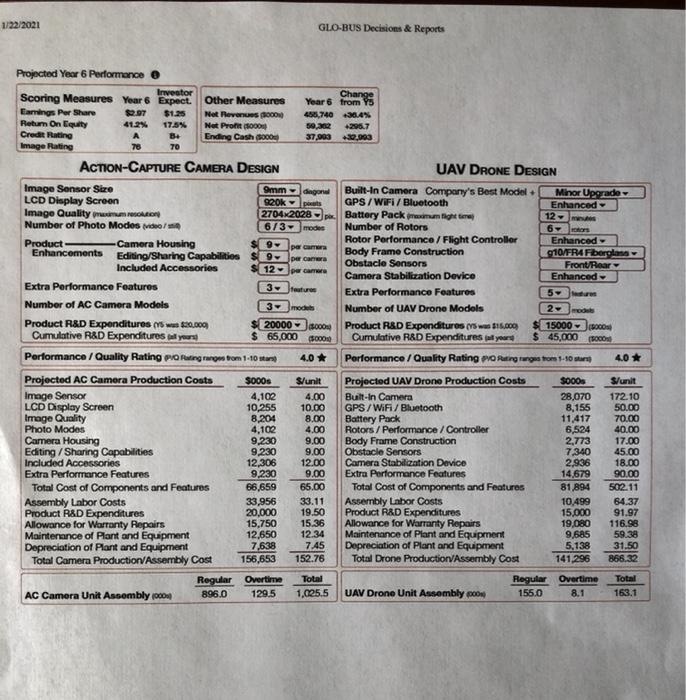
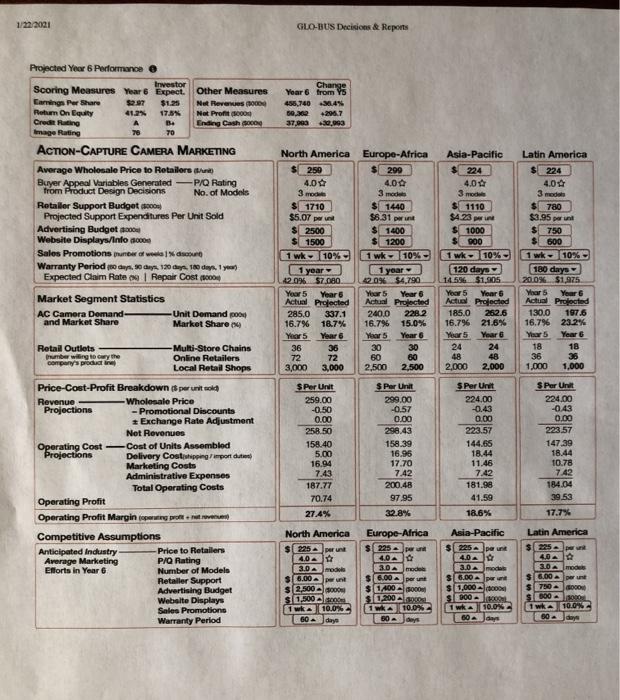
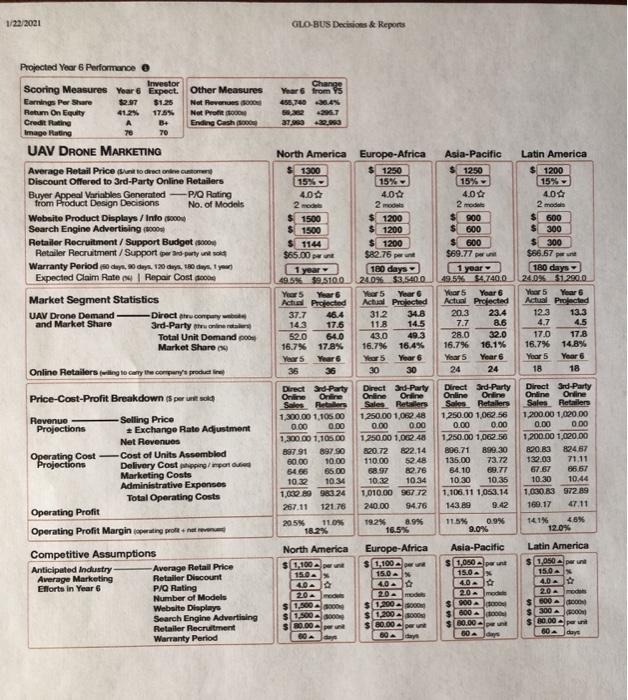
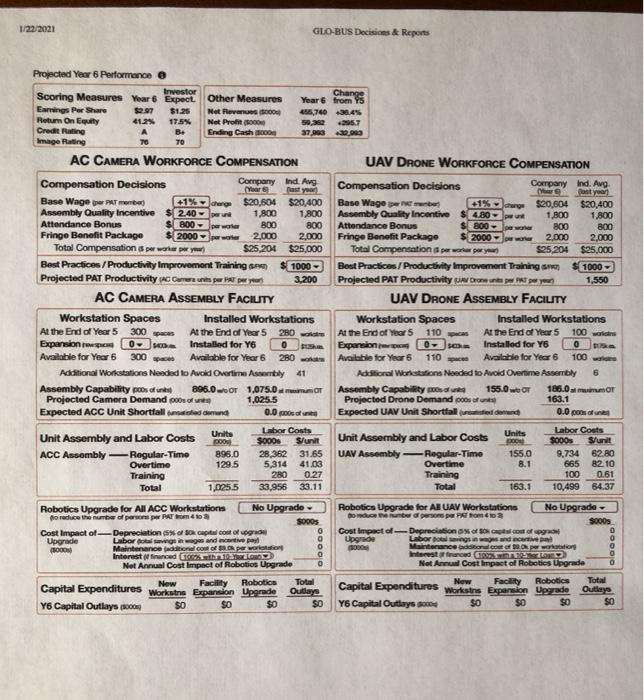
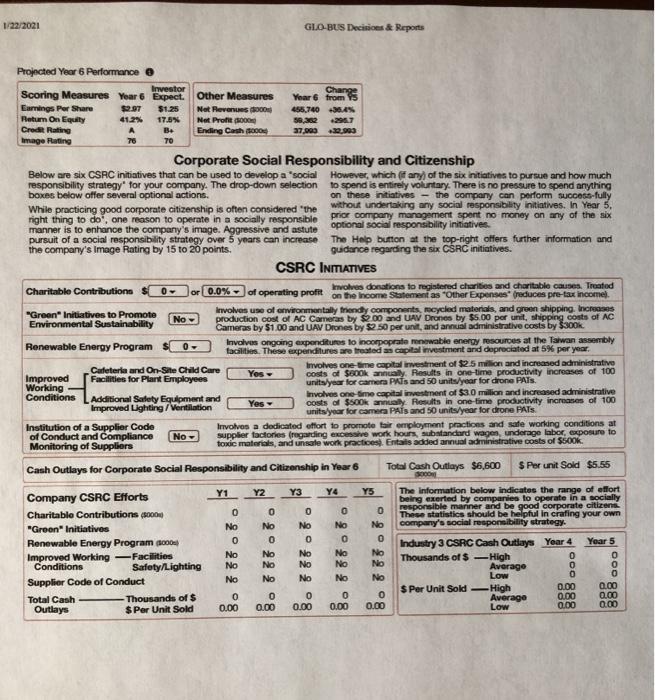
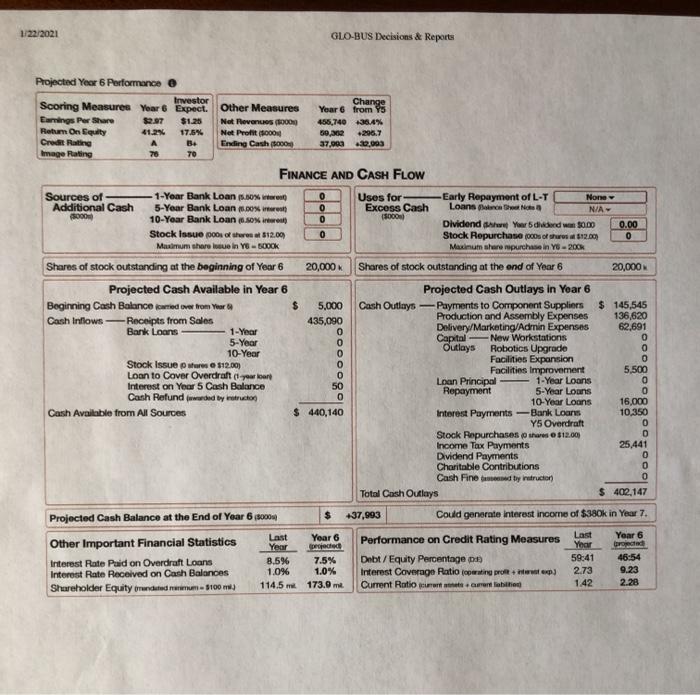
1/22/2021 GLO-BUS Decisions & Reports Changs Ommon 12 Projected Year 6 Performance Investor Scoring Measures Year 6 Expect. Other Measures Year 6 from Y5 Earnings Per Share $1.25 Nel Revenue 456,740 +30.4% Retum On Equity 17.5% Net Profit 59,2 296.7 Cred Rating A Ending Cash (8000 37,903 22,903 Image Rating 78 TO ACTION-CAPTURE CAMERA DESIGN UAV DRONE DESIGN Image Sensor Size Built-In Camera Company's Best Model Minor Upgrade LCD Display Screen 920kps GPS / WiFi / Bluetooth Enhanced Image Quality muun 27042028p Battery Packungen Number of Photo Modes video/ 6/3 modes Number of Rotors Product -Camera Housing 9 Rotor Performance / Flight Controller Enhanced per can Enhancements Editing/Sharing Capabilities 9 Body Frame Construction 10/FR4 Fiberglass De carrera Obstacle Sensors Included Accessories Front Roar $ 12 per camera Camera Stabilization Device Enhanced Extra Performance Features 3- four Extra Performance Features Number of AC Camera Models 3 model Number of UAV Drone Models 2- Product R&D Expenditures (ww $20,000 $20000000 Product R&D Expenditures (Ys was $15.000 $15000 Cumulative R&D Expenditures all your $ 65,000 5000 Cumulative R&D Expenditures in your $ 45,000 3000 Performance / Quality Rating Po Pingwo tom 1-10 ore 4.0 * Performance / Quality Rating pang gusto 1-10 4.0 * Projected AC Camera Production Costs S000s S/unit Projected UAV Drone Production Costs 3000. Sunit Image Sensor 4,102 4.00 Built-In Camera 28,070 172.10 LCD Display Screen 10,255 10.00 GPS / WiFi / Bluetooth 8,155 50.00 Image Quality 8,204 8.00 Battery Pack 11.417 70.00 Photo Modes 4,102 4.00 Rotors / Performance / Controller 6,524 40.00 Camera Housing 9,230 9.00 Body Frame Construction 2,773 17.00 Editing/Sharing Capabilities 9,230 9.00 Obstacle Sensors 7.340 45.00 Included Accessories 12,306 12.00 Camera Stabilization Device 2.936 18.00 Extra Performance Features 9,230 9.00 Extra Performance Features 14.679 90.00 Total Cost of Components and Features 66,659 65.00 Total Cost of Components and Features 81,894 502.11 Assembly Labor Costs 33,956 33.11 Assembly Labor Costs 10,499 64.37 Product R&D Expenditures 20,000 19.50 Product R&D Expenditures 15,000 91.97 Allowance for Warranty Repairs 15,750 15.36 Allowance for Warranty Repairs 19,080 116.98 Maintenance of Plant and Equipment 12,650 12.34 Maintenance of Plant and Equipment 9,685 59.38 Depreciation of Plant and Equipment 7,638 7.45 Depreciation of Plant and Equipment 5,138 31.50 Total Camera Production/Assembly Cost 156,653 152.76 Total Drone Production Assembly Cost 141296 866.32 Regular Overtime Total Regular Overtime Total AC Camera Unit Assembly 2009 896.0 129.5 1.025.5 UAV Drone Unit Assembly 2008 155.0 8.1 163.1 1/22/2001 GLO-BUS Decisions & Reports Change Year 6 from Y5 456,740 2.4 8. +298.7 37,203 30.993 Projected Year 6 Performance e Inwestor Scoring Measures Year 6 Expect. Other Measures Earnings Per Share $2.97 $1.25 Net Reverso Rotum On Equity 01.25 17.5% Not Profit Creding A B. Ending Cash.com Image Rating 70 ACTION-CAPTURE CAMERA MARKETING Average Wholesale Price to Retailers hun) Buyer Appeal Variables Generated P/Q Rating from Product Design Decisions No. of Models Rotaller Support Budget 200 Projected Support Expenditures Per Unit Sold Advertising Budget 1000 Website Displays/Info 1000 Sales Promotions per a wide Warranty Periodica. 90 days 120 180 day. Ty Expected Claim Rate Repair Cost 6000 Market Segment Statistics AC Camera Demand -Unit Demand pool and Market Share Market Share 10 North America Europe-Africa 259 299 4.00 4.09 3 mo 3 modele $ 1710 $ 1440 $5.07 $6.31 $ 2500 $ 1400 $ 1500 1200 1 wk 10% 1 wk 10%- 1 year 1 year 12.06 $7.080 42096 $4.790 Year 5 Yours Year 6 Actual Projected Actual Projected 285.0 337.1 240.0 2282 16.7% 16.7% 16.796 15.0% Years Year Year 5 Year 6 36 36 30 30 72 72 60 80 3,000 3,000 2,500 2,500 Asia-Pacific $ 224 4.04 3 moc $1110 $423 1000 000 1 wk 10% 120 days 14.56 $1.805 Year 5 Yoar Actual Projected 185.0 262.6 16.7% 21.6% Years Year 24 24 48 48 2,000 2,000 Latin America $ 224 4.04 3 model 780 $3.95 per $ 750 $ 600 1 wk 10% 180 days 20.0% $1,975 Year 5 Your Actual Prolected 130,0 1976 16.7% 23.2% Your Year 6 18 18 36 36 1,000 1,000 Year Retail Outlets Dumber willing to Cury the company productie -Multi-Store Chains Online Retailers Local Retail Shops 5 Per Unit 224.00 -0.43 0.00 Price-Cost-Profit Breakdown (per unit old Revenue -Wholesale Price Projections -Promotional Discounts Exchange Rate Adjustment Not Revenues Operating Cost Cost of Units Assembled Projections Delivery Costshipping/import dute Marketing Costs Administrative Expenses Total Operating costs Operating Profit Operating Profit Margin opreg profit net Competitive Assumptions Anticipated Industry Price to Retailers Average Marketing P/Q Rating Efforts in Year 6 Number of Models Retailer Support Advertising Budget Website Displays Sales Promotions Warranty Period SPer Urt 259.00 -0.50 0.00 258.50 158.40 5.00 16.94 7.43 187.77 70.74 27.4% $ Per Unit 299.00 -0.57 0.00 298.43 158.39 16.95 17.70 7.42 200.48 97.95 32.8% 223.57 144.65 18.44 11.46 7.42 181.98 41.59 $ Per Un 224.00 -0.43 0.00 223.57 14739 18.44 10.78 742 184.04 39.53 17.7% 18.6% Asia-Pacific 225 per un 4.0 North America $225 Der 4.00 3.0 A modelo $6.00 $2.500 500 $ 1.500 10.0% Europe-Africa $225 p 4.0 30 ml $6.00 perunt $ 1.400 15.000 $ 1.200 10.0% 50 day SI 6.00 porn $ 1.000.000 S DOO KAN 1 w 10.0% 60 days Latin America $225 4.00 30 AM $600 Der SI 750 GO $100 1wka 10.0 50 days 60 day 1/22/2021 GLO-BUS Decisions & Reports Change Yes from 456,740 2.4 . 27.80 .22.00 Europe-Africa $ 1250 15% 4.0 Projected Year 6 Performance Investor Scoring Measures Year & Expect. Other Measures Earnings Per Share $2.97 $1.25 Net Reverso Rotum On Equity 17.5% Net Profit Credit Rating B+ Ending Cash Image Rating 78 70 UAV DRONE MARKETING Average Retail Price sunt to direct online customer Discount Offered to 3rd-Party Online Retailers Buyer Appeal Variables Generated P/Q Rating from Product Design Decisions No. of Models Website ProductDisplays / Info 2006 Search Engine Advertising 000 Retailer Recruitment / Support Budget 5000 Retailer Recruitment / Support and party Warranty period day, days 120 days 180 dies you Expected Claim Rate 4 Repair Cost come Market Segment Statistics UAV Drone Demand Direct.com and Market Share 3rd-Party niere Total Unit Demand Market Share North America 1300 15% 40 2 model $ 1500 $ 1500 $ 1144 $65.00 Asia-Pacific 12.50 15% 4.00 2 $ 900 $ 600 $ 600 $69.77 1 year 49.5 54.740.0 Year 5 Year 6 Actual Projected 20.3 23.4 7.7 8.6 28.0 32.0 16.7% 16.1% Years Year 6 24 24 $ 1200 $ 1200 $ 1200 $82.76 p 180 days 240 $3.5400 Year 5 Year Actual Projected 312 34.8 11.8 14.5 430 49.3 16.7% 16.4% Year 5 Year 6 30 30 Latin America $ 1200 15% 404 2 mode 600 $300 $ 300 $86.67 180 days 24.096 $1.290.0 Year 5 Year 6 Actual Protected 12.3 13.3 4.7 4.5 17.0 17.8 16.7% 14.8% Year 5 Year6 18 18 49.59 $9.510.0 Years Years Actual Projected 37.7 46.4 14.3 17.6 52.0 64.0 16.7% 17.8% Year 5 Year 36 Online Retailers writing to carry the company's producere Price-Cost-Profit Breakdown $ per Revenue Selling Price Projections Exchange Rate Adjustment Net Revenues Operating Cost -Cost of Units Assomblod Projections Delivery Costpro/import Marketing Costs Administrative Expenses Total Operating costs Operating Profit Operating Profit Margin parating peole na Competitive Assumptions Anticipated Industry Average Retail Price Average Marketing Retaller Discount Efforts in Year 6 P/Q Rating Number of Models Website Display Search Engine Advertising Retailer Recruitment Warranty Period Direct 3rd Party Online Online Seles es 1.300.00 1.10500 0.00 0.00 1,300.00 1.105.00 B0791 897 90 60.00 10.00 64 65 85.00 103 10.34 1.670 80 98324 257.11 121.76 2055 110 18.2% Direct Srd-Party Online Ordine Sales Peters 1.250.00 1.048 0.00 0.00 1.250.00 1.062.48 820.72 822.14 110.00 68.97 82.76 10.32 1034 1.010.00 967 72 240.00 94.76 19.2% 8.9% 16.5% Direct 3rd-Party Online Online Sales Retailers 1.250.00 1.002.56 0.00 0.00 1.250.00 1.002.50 896.71 899.30 135.00 73.72 84.10 69.77 10.30 10.35 1.100.11 1.03.14 143.89 9.42 115 0.9% Direct 3rd Party Online Online Sales Retailers 1,200.00 1,020.00 0.00 O DO 1,200.00 1,020.00 820.83 82467 130.03 71.11 67.67 66 67 10.30 10.44 1.030.83 972 89 169.17 47.11 141 46% 12.0% Latin America 1,050 per und 15.0 N 4.0. 2.0 modo $800 $300 000 $ 0.00 por un 80 days 9.0% Europe-Africa Asia-Pacific North America $ 1.100 15.00 40. 20. 1.500.550 1.100 15.0 N 4.0.0 20 mode $ 1.200.000 15200 $ 30.00 1.050 per 15.0 40. 2.0 mod 0000 800.000 30.00 00 $ 0.00 1/22/2021 GLO-BUS Decisice & Reports pen wan 110 100 wa Projected Year 6 Performance Investor Scoring Measures Year 6 Expect. Other Measures Change Year 6 from Y5 Earnings Per Share $2.99 $1.25 Net Revu000 455,740 2.45 Return On Equity 41.25 17.5% Net Profit (1000 50 382 2057 Cred Rating A B+ Ending Cashcoon 37.903 22.900 Image Rating TO TO AC CAMERA WORKFORCE COMPENSATION UAV DRONE WORKFORCE COMPENSATION Compensation Decisions Company Ind. Avg Year Compensation Decisions Company Ind. Avg. Gasty Base Wage AT member +1% der $20.604 $20,400 Base Wage +1% Junge $20,604 $20,400 Assembly Quality Incentive $ 240 1,800 1,800 Assembly Quality Incentive $4.80 1,800 1.800 Attendance Bonus $800 800 800 Attendance Bonus $800- 800 800 Fringe Benefit Package $ 2000 2,000 2,000 Fringe Benefit Package 2000 2,000 2.000 Total Compensation per way $25,204 $25,000 Total Compensation per monterey 525204 $25,000 Best Practices / Productivity Improvement Training an $1000 Best Practices/Productivity Improvement Training $1000 Projected PAT Productivity C Cars unts per per your 3.200 Projected PAT Productivity My Drone 1,550 AC CAMERA ASSEMBLY FACILITY UAV DRONE ASSEMBLY FACILITY Workstation Spaces Installed Workstations Workstation Spaces Installed Workstations At the End of Year 5300 At the End of Year 5 280 At the End of Year 5 At the End of Year 5 Expansion Installed for Y6 0 Expansion 0 = Installed for Y6 0 Available for Year 6 300 Available for Year 6 280 Avaible for Year 6 Available for Year 6 100 w Additional Workstations Needed to Avoid Overtime Awarmbly Additional Workstations Needed to Avold Overtime Assembly 6 Assembly Capability console 896.0 or 1,075,0mmor Assembly Capability 155.0 WOT 186.0 mm Projected Camera Demands of 1,025.5 Projected Drone Demand cons of units 163.1 Expected ACC Unit Shortfallmedemund 0.000 Expected UAV Unit Shortfald end 0.00 Units Labor Costs Units Unit Assembly and Labor Costs Labor Costs DOON $000s Sunit Unit Assembly and Labor Costs $000s S/unit ACC Assembly Regular-Time 896.0 28,362 31.65 UAV Assembly Regular-Time 155.0 9,734 62.80 Overtime 129.5 41.03 Overtime 8.1 665 8210 Training 280 0.27 Training 100 0.61 Total 1.025.5 33.956 33.11 Total 163.1 10,499 64.37 Robotics Upgrade for All ACC Workstations No Upgrade Robotics Upgrade for AE UAV Workstations No Upgrade- Ao reduce the number of persons per PATom 40 a Door meer of persone promesa 5000 S000 Cost Impact of Depreciation of capital cost of pro 0 Cost Impact of Depreciation of alcool Upgrade Laborales and cari pel 0 Upgrade Laborbolinde (8000 Maintenance ditore con of per wartoon o Maintenance and corporation Interest frienced tha 10 Interest in franced CILOR Not Annual Cost Impact of Robotics Upgrade Net Annual Cost impact of Robotics Upgrade Facility New Robotics Total New Facility Robotics Total Capital Expenditures Workstro Expansion Upgrade Outlay Capital Expenditures Workestra Expansion Upgrade Outluye $0 $o $0 Y6 Capital Outlays 1000 $0 $0 $0 Y6 Capital Outleys 2000 $0 $0 110 5,314 ooooo 0 1/22/2021 GLO-BUS Decisions & Reports Youre Gomes Projected Year 6 Performance Investor Scoring Measures Year 6 Expect. Other Measures Earnings Per Share $2.97 $1.25 Not even 455,740 6.4 Retum On Equity 41.25 17.5 Net Profit 3000 59,262 2967 Cred Rating A B. Ending Cash 6000 27903 32.90 Image Rating 70 Corporate Social Responsibility and Citizenship Below are six CSRC initiatives that can be used to develop a social However, which if any of the six initiatives to pursue and how much responsibility strategy for your company. The drop-down selection to spend is entirely voluntary. There is no pressure to spend anything boxes below offer several optional actions. on these initiatives - the company can perform successfully While practicing good corporate citizenship is often considered the without undertaking any social responsibility initiatives. In Year 5. right thing to do, one reason to operate in a socially responsible prior company management spent no money on any of the six manner is to enhance the company's image. Aggressive and astute optional social responsibility initiatives pursuit of a social responsibility strategy over years can increase The Help button at the top-right offers further information and the company's Image Rating by 15 to 20 points. guidance regarding the six CSRC initiatives. CSRC INITIATIVES Charitable Contributions $0. or 0.0% of operating profit on the income Statement as "Other Expenses reduces pre-tax incomel. Involves donations to registered charities and charitable causes. Treated "Green" Initiatives to promote Involves use of environmentally friendly components, recycled materials, and green shipping. Increases No Environmental Sustainability production cost of AC Carneras by 9.00 and UAV Drones by $5.00 per unit, shipping costs of AC Cameras by $1.00 and UAV Drones by $2.50 per unit, and annual administrative costs by $300k. Renewable Energy Program 0- Involves ongoing expenditures to incorporate newable energy resources at the Taiwan assembly facilities. These expenditures are treated as capital investment and depreciated at 5% per year. Cafeteria and On-Site Child Care Involves one time capital investment of $2.5 million and increased administrative Improved Yes Facilities for Plant Employees costs of $600k annually Results in one-time productivity increases of 100 Working unitsynar for camera PATs and 50 units/year for drone PATS. Conditions Additional Safety Equipment and Involves one-time capital investment of $3.0 million and increased administrative Improved Lighting / Ventilation Yes costs of $500k annual Results in one-time productivity increases of 100 unitsyear for camera PAIS and 50 unitsyear for drone PATS Institution of a Supplier Code Involves a dedicated effort to promote tair employment practions and safe working conditions at of Conduct and Compliance No supplier factories regarding excessive work hours, substandard wagen, underage labor, exposure to Monitoring of Suppliers toxic materials, and unsafe work practices. Entails added annual administrative costs of $500k. Cash Outlays for Corporate Social Responsibility and Citizenship in Year 6 Total Cash Outlays $6,600 $ Per unit Sold $5.55 SON Y1 Y4 Y5 No Company CSRC Efforts Charitable Contributions (0000 "Green" Initiatives Renewable Energy Program (1000 Improved Working Facilities Conditions Safety Lighting Supplier Code of Conduct Total Cash Thousands of $ Outlays $ Per Unit Sold 0 No o No No No Y2 0 No 0 No No No Y3 0 No 0 No No No agonggog 0 No 0 No No No No No No The information below indicates the range of effort being exerted by companies to operate in a socially responsible manner and be good corporate citizens These statistics should be helpful in crafing your own company's social responsibility strategy. Industry 3 CSRC Cash Outlays Year 4 Year 5 Thousands of $ High O 0 Averago 0 Low 0 $ Per Unit Sold High 0.00 0.00 Average 0.00 0.00 Low 0.00 0.00 0 0.00 0 0.00 0 0.00 0 0.00 0 0.00 0880 1/22/2021 GLO-BUS Decisions & Reports Projected Year 6 Performance Scoring Measures Year 6 Expect. Other Measures Investor Change Year 6 from YS Earnings Per Share $1.25 Not revenues (000 456,740 36.4% Retum On Equity 41.2 17.6% Net Profit (000 59,202 296.7 Credit Rating A B. Ending Cash 8000 37.900 0.003 Image Rating 76 70 FINANCE AND CASH Flow Sources of 1-Year Bank Loan (5.00% were 0 Uses for Early Repayment of L-T Non Additional Cash 5-Year Bank Loan 6.00 0 Excess Cash Loans en N/A 48000 10-Year Bank Loan (6.0) 0 18000 Dividend Yer dideed was $0.00 0.00 Stock Issue pots of west 12.00 0 Stock Ropurchase os of $12.00 0 Maximum shore loue in YG - 500k Maximum share purchase in Yo-2008 Shares of stock outstanding at the beginning of Year 6 20,000 Shares of stock outstanding at the end of Year 6 20,000 Projected Cash Available in Year 6 Projected Cash Outlays in Year 6 Beginning Cash Balance carried over from Year * $ 5,000 Cash Outlays -Payments to Component Suppliers $ 145,545 435,090 Cash Inflows - Receipts from Sales 136,620 Production and Assembly Expenses Bank Loans 1-Year 0 Delivery/Marketing/Admin Expenses 62,691 5-Year Capital 0 New Workstations Outlays 10-Year Robotics Upgrade 0 0 Stock Issue pares 112.00) Facilities Expansion 0 5,500 Loan to Cover Overdraft (you are Facilities Improvement 1-Year Loans Interest on Year 5 Cash Balance Loan Principal 0 50 Cash Refund wurded by con Repayment 5-Year Loans 0 10-Year Loans Cash Available from All Sources $ 440,140 Interest Payments -Bank Loarys Y5 Overdraft Stock Repurchases shares $12.00 0 Income Tax Payments 25,441 Dividend Payments 0 Charitable Contributions 0 Cash Fine by instructor 0 Total Cash Outlays $ 402,147 Projected Cash Balance at the End of Year 6000 $ +37,993 Could generate interest income of $380k in Year 7. Last Year 6 Last Year 6 Other Important Financial Statistics Performance on Credit Rating Measures Year Year 8.596 7.5% Interest Rate Paid on Overdraft Loans 59:41 Debt/Equity Percentage 1 46:54 1.0% Interest Rate Received on Cash Balances 1.0% Interest Coverage ratio operating profit 2.73 9.23 114.5 m 173.9 m. 1.42 Shureholder Equityorundutud namun - 5100 Current Ratio curtearen abilities 2.28 1/22/2021 GLO-BUS Decisions & Reports Changs Ommon 12 Projected Year 6 Performance Investor Scoring Measures Year 6 Expect. Other Measures Year 6 from Y5 Earnings Per Share $1.25 Nel Revenue 456,740 +30.4% Retum On Equity 17.5% Net Profit 59,2 296.7 Cred Rating A Ending Cash (8000 37,903 22,903 Image Rating 78 TO ACTION-CAPTURE CAMERA DESIGN UAV DRONE DESIGN Image Sensor Size Built-In Camera Company's Best Model Minor Upgrade LCD Display Screen 920kps GPS / WiFi / Bluetooth Enhanced Image Quality muun 27042028p Battery Packungen Number of Photo Modes video/ 6/3 modes Number of Rotors Product -Camera Housing 9 Rotor Performance / Flight Controller Enhanced per can Enhancements Editing/Sharing Capabilities 9 Body Frame Construction 10/FR4 Fiberglass De carrera Obstacle Sensors Included Accessories Front Roar $ 12 per camera Camera Stabilization Device Enhanced Extra Performance Features 3- four Extra Performance Features Number of AC Camera Models 3 model Number of UAV Drone Models 2- Product R&D Expenditures (ww $20,000 $20000000 Product R&D Expenditures (Ys was $15.000 $15000 Cumulative R&D Expenditures all your $ 65,000 5000 Cumulative R&D Expenditures in your $ 45,000 3000 Performance / Quality Rating Po Pingwo tom 1-10 ore 4.0 * Performance / Quality Rating pang gusto 1-10 4.0 * Projected AC Camera Production Costs S000s S/unit Projected UAV Drone Production Costs 3000. Sunit Image Sensor 4,102 4.00 Built-In Camera 28,070 172.10 LCD Display Screen 10,255 10.00 GPS / WiFi / Bluetooth 8,155 50.00 Image Quality 8,204 8.00 Battery Pack 11.417 70.00 Photo Modes 4,102 4.00 Rotors / Performance / Controller 6,524 40.00 Camera Housing 9,230 9.00 Body Frame Construction 2,773 17.00 Editing/Sharing Capabilities 9,230 9.00 Obstacle Sensors 7.340 45.00 Included Accessories 12,306 12.00 Camera Stabilization Device 2.936 18.00 Extra Performance Features 9,230 9.00 Extra Performance Features 14.679 90.00 Total Cost of Components and Features 66,659 65.00 Total Cost of Components and Features 81,894 502.11 Assembly Labor Costs 33,956 33.11 Assembly Labor Costs 10,499 64.37 Product R&D Expenditures 20,000 19.50 Product R&D Expenditures 15,000 91.97 Allowance for Warranty Repairs 15,750 15.36 Allowance for Warranty Repairs 19,080 116.98 Maintenance of Plant and Equipment 12,650 12.34 Maintenance of Plant and Equipment 9,685 59.38 Depreciation of Plant and Equipment 7,638 7.45 Depreciation of Plant and Equipment 5,138 31.50 Total Camera Production/Assembly Cost 156,653 152.76 Total Drone Production Assembly Cost 141296 866.32 Regular Overtime Total Regular Overtime Total AC Camera Unit Assembly 2009 896.0 129.5 1.025.5 UAV Drone Unit Assembly 2008 155.0 8.1 163.1 1/22/2001 GLO-BUS Decisions & Reports Change Year 6 from Y5 456,740 2.4 8. +298.7 37,203 30.993 Projected Year 6 Performance e Inwestor Scoring Measures Year 6 Expect. Other Measures Earnings Per Share $2.97 $1.25 Net Reverso Rotum On Equity 01.25 17.5% Not Profit Creding A B. Ending Cash.com Image Rating 70 ACTION-CAPTURE CAMERA MARKETING Average Wholesale Price to Retailers hun) Buyer Appeal Variables Generated P/Q Rating from Product Design Decisions No. of Models Rotaller Support Budget 200 Projected Support Expenditures Per Unit Sold Advertising Budget 1000 Website Displays/Info 1000 Sales Promotions per a wide Warranty Periodica. 90 days 120 180 day. Ty Expected Claim Rate Repair Cost 6000 Market Segment Statistics AC Camera Demand -Unit Demand pool and Market Share Market Share 10 North America Europe-Africa 259 299 4.00 4.09 3 mo 3 modele $ 1710 $ 1440 $5.07 $6.31 $ 2500 $ 1400 $ 1500 1200 1 wk 10% 1 wk 10%- 1 year 1 year 12.06 $7.080 42096 $4.790 Year 5 Yours Year 6 Actual Projected Actual Projected 285.0 337.1 240.0 2282 16.7% 16.7% 16.796 15.0% Years Year Year 5 Year 6 36 36 30 30 72 72 60 80 3,000 3,000 2,500 2,500 Asia-Pacific $ 224 4.04 3 moc $1110 $423 1000 000 1 wk 10% 120 days 14.56 $1.805 Year 5 Yoar Actual Projected 185.0 262.6 16.7% 21.6% Years Year 24 24 48 48 2,000 2,000 Latin America $ 224 4.04 3 model 780 $3.95 per $ 750 $ 600 1 wk 10% 180 days 20.0% $1,975 Year 5 Your Actual Prolected 130,0 1976 16.7% 23.2% Your Year 6 18 18 36 36 1,000 1,000 Year Retail Outlets Dumber willing to Cury the company productie -Multi-Store Chains Online Retailers Local Retail Shops 5 Per Unit 224.00 -0.43 0.00 Price-Cost-Profit Breakdown (per unit old Revenue -Wholesale Price Projections -Promotional Discounts Exchange Rate Adjustment Not Revenues Operating Cost Cost of Units Assembled Projections Delivery Costshipping/import dute Marketing Costs Administrative Expenses Total Operating costs Operating Profit Operating Profit Margin opreg profit net Competitive Assumptions Anticipated Industry Price to Retailers Average Marketing P/Q Rating Efforts in Year 6 Number of Models Retailer Support Advertising Budget Website Displays Sales Promotions Warranty Period SPer Urt 259.00 -0.50 0.00 258.50 158.40 5.00 16.94 7.43 187.77 70.74 27.4% $ Per Unit 299.00 -0.57 0.00 298.43 158.39 16.95 17.70 7.42 200.48 97.95 32.8% 223.57 144.65 18.44 11.46 7.42 181.98 41.59 $ Per Un 224.00 -0.43 0.00 223.57 14739 18.44 10.78 742 184.04 39.53 17.7% 18.6% Asia-Pacific 225 per un 4.0 North America $225 Der 4.00 3.0 A modelo $6.00 $2.500 500 $ 1.500 10.0% Europe-Africa $225 p 4.0 30 ml $6.00 perunt $ 1.400 15.000 $ 1.200 10.0% 50 day SI 6.00 porn $ 1.000.000 S DOO KAN 1 w 10.0% 60 days Latin America $225 4.00 30 AM $600 Der SI 750 GO $100 1wka 10.0 50 days 60 day 1/22/2021 GLO-BUS Decisions & Reports Change Yes from 456,740 2.4 . 27.80 .22.00 Europe-Africa $ 1250 15% 4.0 Projected Year 6 Performance Investor Scoring Measures Year & Expect. Other Measures Earnings Per Share $2.97 $1.25 Net Reverso Rotum On Equity 17.5% Net Profit Credit Rating B+ Ending Cash Image Rating 78 70 UAV DRONE MARKETING Average Retail Price sunt to direct online customer Discount Offered to 3rd-Party Online Retailers Buyer Appeal Variables Generated P/Q Rating from Product Design Decisions No. of Models Website ProductDisplays / Info 2006 Search Engine Advertising 000 Retailer Recruitment / Support Budget 5000 Retailer Recruitment / Support and party Warranty period day, days 120 days 180 dies you Expected Claim Rate 4 Repair Cost come Market Segment Statistics UAV Drone Demand Direct.com and Market Share 3rd-Party niere Total Unit Demand Market Share North America 1300 15% 40 2 model $ 1500 $ 1500 $ 1144 $65.00 Asia-Pacific 12.50 15% 4.00 2 $ 900 $ 600 $ 600 $69.77 1 year 49.5 54.740.0 Year 5 Year 6 Actual Projected 20.3 23.4 7.7 8.6 28.0 32.0 16.7% 16.1% Years Year 6 24 24 $ 1200 $ 1200 $ 1200 $82.76 p 180 days 240 $3.5400 Year 5 Year Actual Projected 312 34.8 11.8 14.5 430 49.3 16.7% 16.4% Year 5 Year 6 30 30 Latin America $ 1200 15% 404 2 mode 600 $300 $ 300 $86.67 180 days 24.096 $1.290.0 Year 5 Year 6 Actual Protected 12.3 13.3 4.7 4.5 17.0 17.8 16.7% 14.8% Year 5 Year6 18 18 49.59 $9.510.0 Years Years Actual Projected 37.7 46.4 14.3 17.6 52.0 64.0 16.7% 17.8% Year 5 Year 36 Online Retailers writing to carry the company's producere Price-Cost-Profit Breakdown $ per Revenue Selling Price Projections Exchange Rate Adjustment Net Revenues Operating Cost -Cost of Units Assomblod Projections Delivery Costpro/import Marketing Costs Administrative Expenses Total Operating costs Operating Profit Operating Profit Margin parating peole na Competitive Assumptions Anticipated Industry Average Retail Price Average Marketing Retaller Discount Efforts in Year 6 P/Q Rating Number of Models Website Display Search Engine Advertising Retailer Recruitment Warranty Period Direct 3rd Party Online Online Seles es 1.300.00 1.10500 0.00 0.00 1,300.00 1.105.00 B0791 897 90 60.00 10.00 64 65 85.00 103 10.34 1.670 80 98324 257.11 121.76 2055 110 18.2% Direct Srd-Party Online Ordine Sales Peters 1.250.00 1.048 0.00 0.00 1.250.00 1.062.48 820.72 822.14 110.00 68.97 82.76 10.32 1034 1.010.00 967 72 240.00 94.76 19.2% 8.9% 16.5% Direct 3rd-Party Online Online Sales Retailers 1.250.00 1.002.56 0.00 0.00 1.250.00 1.002.50 896.71 899.30 135.00 73.72 84.10 69.77 10.30 10.35 1.100.11 1.03.14 143.89 9.42 115 0.9% Direct 3rd Party Online Online Sales Retailers 1,200.00 1,020.00 0.00 O DO 1,200.00 1,020.00 820.83 82467 130.03 71.11 67.67 66 67 10.30 10.44 1.030.83 972 89 169.17 47.11 141 46% 12.0% Latin America 1,050 per und 15.0 N 4.0. 2.0 modo $800 $300 000 $ 0.00 por un 80 days 9.0% Europe-Africa Asia-Pacific North America $ 1.100 15.00 40. 20. 1.500.550 1.100 15.0 N 4.0.0 20 mode $ 1.200.000 15200 $ 30.00 1.050 per 15.0 40. 2.0 mod 0000 800.000 30.00 00 $ 0.00 1/22/2021 GLO-BUS Decisice & Reports pen wan 110 100 wa Projected Year 6 Performance Investor Scoring Measures Year 6 Expect. Other Measures Change Year 6 from Y5 Earnings Per Share $2.99 $1.25 Net Revu000 455,740 2.45 Return On Equity 41.25 17.5% Net Profit (1000 50 382 2057 Cred Rating A B+ Ending Cashcoon 37.903 22.900 Image Rating TO TO AC CAMERA WORKFORCE COMPENSATION UAV DRONE WORKFORCE COMPENSATION Compensation Decisions Company Ind. Avg Year Compensation Decisions Company Ind. Avg. Gasty Base Wage AT member +1% der $20.604 $20,400 Base Wage +1% Junge $20,604 $20,400 Assembly Quality Incentive $ 240 1,800 1,800 Assembly Quality Incentive $4.80 1,800 1.800 Attendance Bonus $800 800 800 Attendance Bonus $800- 800 800 Fringe Benefit Package $ 2000 2,000 2,000 Fringe Benefit Package 2000 2,000 2.000 Total Compensation per way $25,204 $25,000 Total Compensation per monterey 525204 $25,000 Best Practices / Productivity Improvement Training an $1000 Best Practices/Productivity Improvement Training $1000 Projected PAT Productivity C Cars unts per per your 3.200 Projected PAT Productivity My Drone 1,550 AC CAMERA ASSEMBLY FACILITY UAV DRONE ASSEMBLY FACILITY Workstation Spaces Installed Workstations Workstation Spaces Installed Workstations At the End of Year 5300 At the End of Year 5 280 At the End of Year 5 At the End of Year 5 Expansion Installed for Y6 0 Expansion 0 = Installed for Y6 0 Available for Year 6 300 Available for Year 6 280 Avaible for Year 6 Available for Year 6 100 w Additional Workstations Needed to Avoid Overtime Awarmbly Additional Workstations Needed to Avold Overtime Assembly 6 Assembly Capability console 896.0 or 1,075,0mmor Assembly Capability 155.0 WOT 186.0 mm Projected Camera Demands of 1,025.5 Projected Drone Demand cons of units 163.1 Expected ACC Unit Shortfallmedemund 0.000 Expected UAV Unit Shortfald end 0.00 Units Labor Costs Units Unit Assembly and Labor Costs Labor Costs DOON $000s Sunit Unit Assembly and Labor Costs $000s S/unit ACC Assembly Regular-Time 896.0 28,362 31.65 UAV Assembly Regular-Time 155.0 9,734 62.80 Overtime 129.5 41.03 Overtime 8.1 665 8210 Training 280 0.27 Training 100 0.61 Total 1.025.5 33.956 33.11 Total 163.1 10,499 64.37 Robotics Upgrade for All ACC Workstations No Upgrade Robotics Upgrade for AE UAV Workstations No Upgrade- Ao reduce the number of persons per PATom 40 a Door meer of persone promesa 5000 S000 Cost Impact of Depreciation of capital cost of pro 0 Cost Impact of Depreciation of alcool Upgrade Laborales and cari pel 0 Upgrade Laborbolinde (8000 Maintenance ditore con of per wartoon o Maintenance and corporation Interest frienced tha 10 Interest in franced CILOR Not Annual Cost Impact of Robotics Upgrade Net Annual Cost impact of Robotics Upgrade Facility New Robotics Total New Facility Robotics Total Capital Expenditures Workstro Expansion Upgrade Outlay Capital Expenditures Workestra Expansion Upgrade Outluye $0 $o $0 Y6 Capital Outlays 1000 $0 $0 $0 Y6 Capital Outleys 2000 $0 $0 110 5,314 ooooo 0 1/22/2021 GLO-BUS Decisions & Reports Youre Gomes Projected Year 6 Performance Investor Scoring Measures Year 6 Expect. Other Measures Earnings Per Share $2.97 $1.25 Not even 455,740 6.4 Retum On Equity 41.25 17.5 Net Profit 3000 59,262 2967 Cred Rating A B. Ending Cash 6000 27903 32.90 Image Rating 70 Corporate Social Responsibility and Citizenship Below are six CSRC initiatives that can be used to develop a social However, which if any of the six initiatives to pursue and how much responsibility strategy for your company. The drop-down selection to spend is entirely voluntary. There is no pressure to spend anything boxes below offer several optional actions. on these initiatives - the company can perform successfully While practicing good corporate citizenship is often considered the without undertaking any social responsibility initiatives. In Year 5. right thing to do, one reason to operate in a socially responsible prior company management spent no money on any of the six manner is to enhance the company's image. Aggressive and astute optional social responsibility initiatives pursuit of a social responsibility strategy over years can increase The Help button at the top-right offers further information and the company's Image Rating by 15 to 20 points. guidance regarding the six CSRC initiatives. CSRC INITIATIVES Charitable Contributions $0. or 0.0% of operating profit on the income Statement as "Other Expenses reduces pre-tax incomel. Involves donations to registered charities and charitable causes. Treated "Green" Initiatives to promote Involves use of environmentally friendly components, recycled materials, and green shipping. Increases No Environmental Sustainability production cost of AC Carneras by 9.00 and UAV Drones by $5.00 per unit, shipping costs of AC Cameras by $1.00 and UAV Drones by $2.50 per unit, and annual administrative costs by $300k. Renewable Energy Program 0- Involves ongoing expenditures to incorporate newable energy resources at the Taiwan assembly facilities. These expenditures are treated as capital investment and depreciated at 5% per year. Cafeteria and On-Site Child Care Involves one time capital investment of $2.5 million and increased administrative Improved Yes Facilities for Plant Employees costs of $600k annually Results in one-time productivity increases of 100 Working unitsynar for camera PATs and 50 units/year for drone PATS. Conditions Additional Safety Equipment and Involves one-time capital investment of $3.0 million and increased administrative Improved Lighting / Ventilation Yes costs of $500k annual Results in one-time productivity increases of 100 unitsyear for camera PAIS and 50 unitsyear for drone PATS Institution of a Supplier Code Involves a dedicated effort to promote tair employment practions and safe working conditions at of Conduct and Compliance No supplier factories regarding excessive work hours, substandard wagen, underage labor, exposure to Monitoring of Suppliers toxic materials, and unsafe work practices. Entails added annual administrative costs of $500k. Cash Outlays for Corporate Social Responsibility and Citizenship in Year 6 Total Cash Outlays $6,600 $ Per unit Sold $5.55 SON Y1 Y4 Y5 No Company CSRC Efforts Charitable Contributions (0000 "Green" Initiatives Renewable Energy Program (1000 Improved Working Facilities Conditions Safety Lighting Supplier Code of Conduct Total Cash Thousands of $ Outlays $ Per Unit Sold 0 No o No No No Y2 0 No 0 No No No Y3 0 No 0 No No No agonggog 0 No 0 No No No No No No The information below indicates the range of effort being exerted by companies to operate in a socially responsible manner and be good corporate citizens These statistics should be helpful in crafing your own company's social responsibility strategy. Industry 3 CSRC Cash Outlays Year 4 Year 5 Thousands of $ High O 0 Averago 0 Low 0 $ Per Unit Sold High 0.00 0.00 Average 0.00 0.00 Low 0.00 0.00 0 0.00 0 0.00 0 0.00 0 0.00 0 0.00 0880 1/22/2021 GLO-BUS Decisions & Reports Projected Year 6 Performance Scoring Measures Year 6 Expect. Other Measures Investor Change Year 6 from YS Earnings Per Share $1.25 Not revenues (000 456,740 36.4% Retum On Equity 41.2 17.6% Net Profit (000 59,202 296.7 Credit Rating A B. Ending Cash 8000 37.900 0.003 Image Rating 76 70 FINANCE AND CASH Flow Sources of 1-Year Bank Loan (5.00% were 0 Uses for Early Repayment of L-T Non Additional Cash 5-Year Bank Loan 6.00 0 Excess Cash Loans en N/A 48000 10-Year Bank Loan (6.0) 0 18000 Dividend Yer dideed was $0.00 0.00 Stock Issue pots of west 12.00 0 Stock Ropurchase os of $12.00 0 Maximum shore loue in YG - 500k Maximum share purchase in Yo-2008 Shares of stock outstanding at the beginning of Year 6 20,000 Shares of stock outstanding at the end of Year 6 20,000 Projected Cash Available in Year 6 Projected Cash Outlays in Year 6 Beginning Cash Balance carried over from Year * $ 5,000 Cash Outlays -Payments to Component Suppliers $ 145,545 435,090 Cash Inflows - Receipts from Sales 136,620 Production and Assembly Expenses Bank Loans 1-Year 0 Delivery/Marketing/Admin Expenses 62,691 5-Year Capital 0 New Workstations Outlays 10-Year Robotics Upgrade 0 0 Stock Issue pares 112.00) Facilities Expansion 0 5,500 Loan to Cover Overdraft (you are Facilities Improvement 1-Year Loans Interest on Year 5 Cash Balance Loan Principal 0 50 Cash Refund wurded by con Repayment 5-Year Loans 0 10-Year Loans Cash Available from All Sources $ 440,140 Interest Payments -Bank Loarys Y5 Overdraft Stock Repurchases shares $12.00 0 Income Tax Payments 25,441 Dividend Payments 0 Charitable Contributions 0 Cash Fine by instructor 0 Total Cash Outlays $ 402,147 Projected Cash Balance at the End of Year 6000 $ +37,993 Could generate interest income of $380k in Year 7. Last Year 6 Last Year 6 Other Important Financial Statistics Performance on Credit Rating Measures Year Year 8.596 7.5% Interest Rate Paid on Overdraft Loans 59:41 Debt/Equity Percentage 1 46:54 1.0% Interest Rate Received on Cash Balances 1.0% Interest Coverage ratio operating profit 2.73 9.23 114.5 m 173.9 m. 1.42 Shureholder Equityorundutud namun - 5100 Current Ratio curtearen abilities 2.28
Step by Step Solution
There are 3 Steps involved in it

Get step-by-step solutions from verified subject matter experts