

Question: Can you explain this I'm doing some practice questions FULL-TIME FACULTY MEMBERS The number of full-time (FT) faculty members at 4-year colleges and universities (in
Can you explain this I'm doing some practice questions
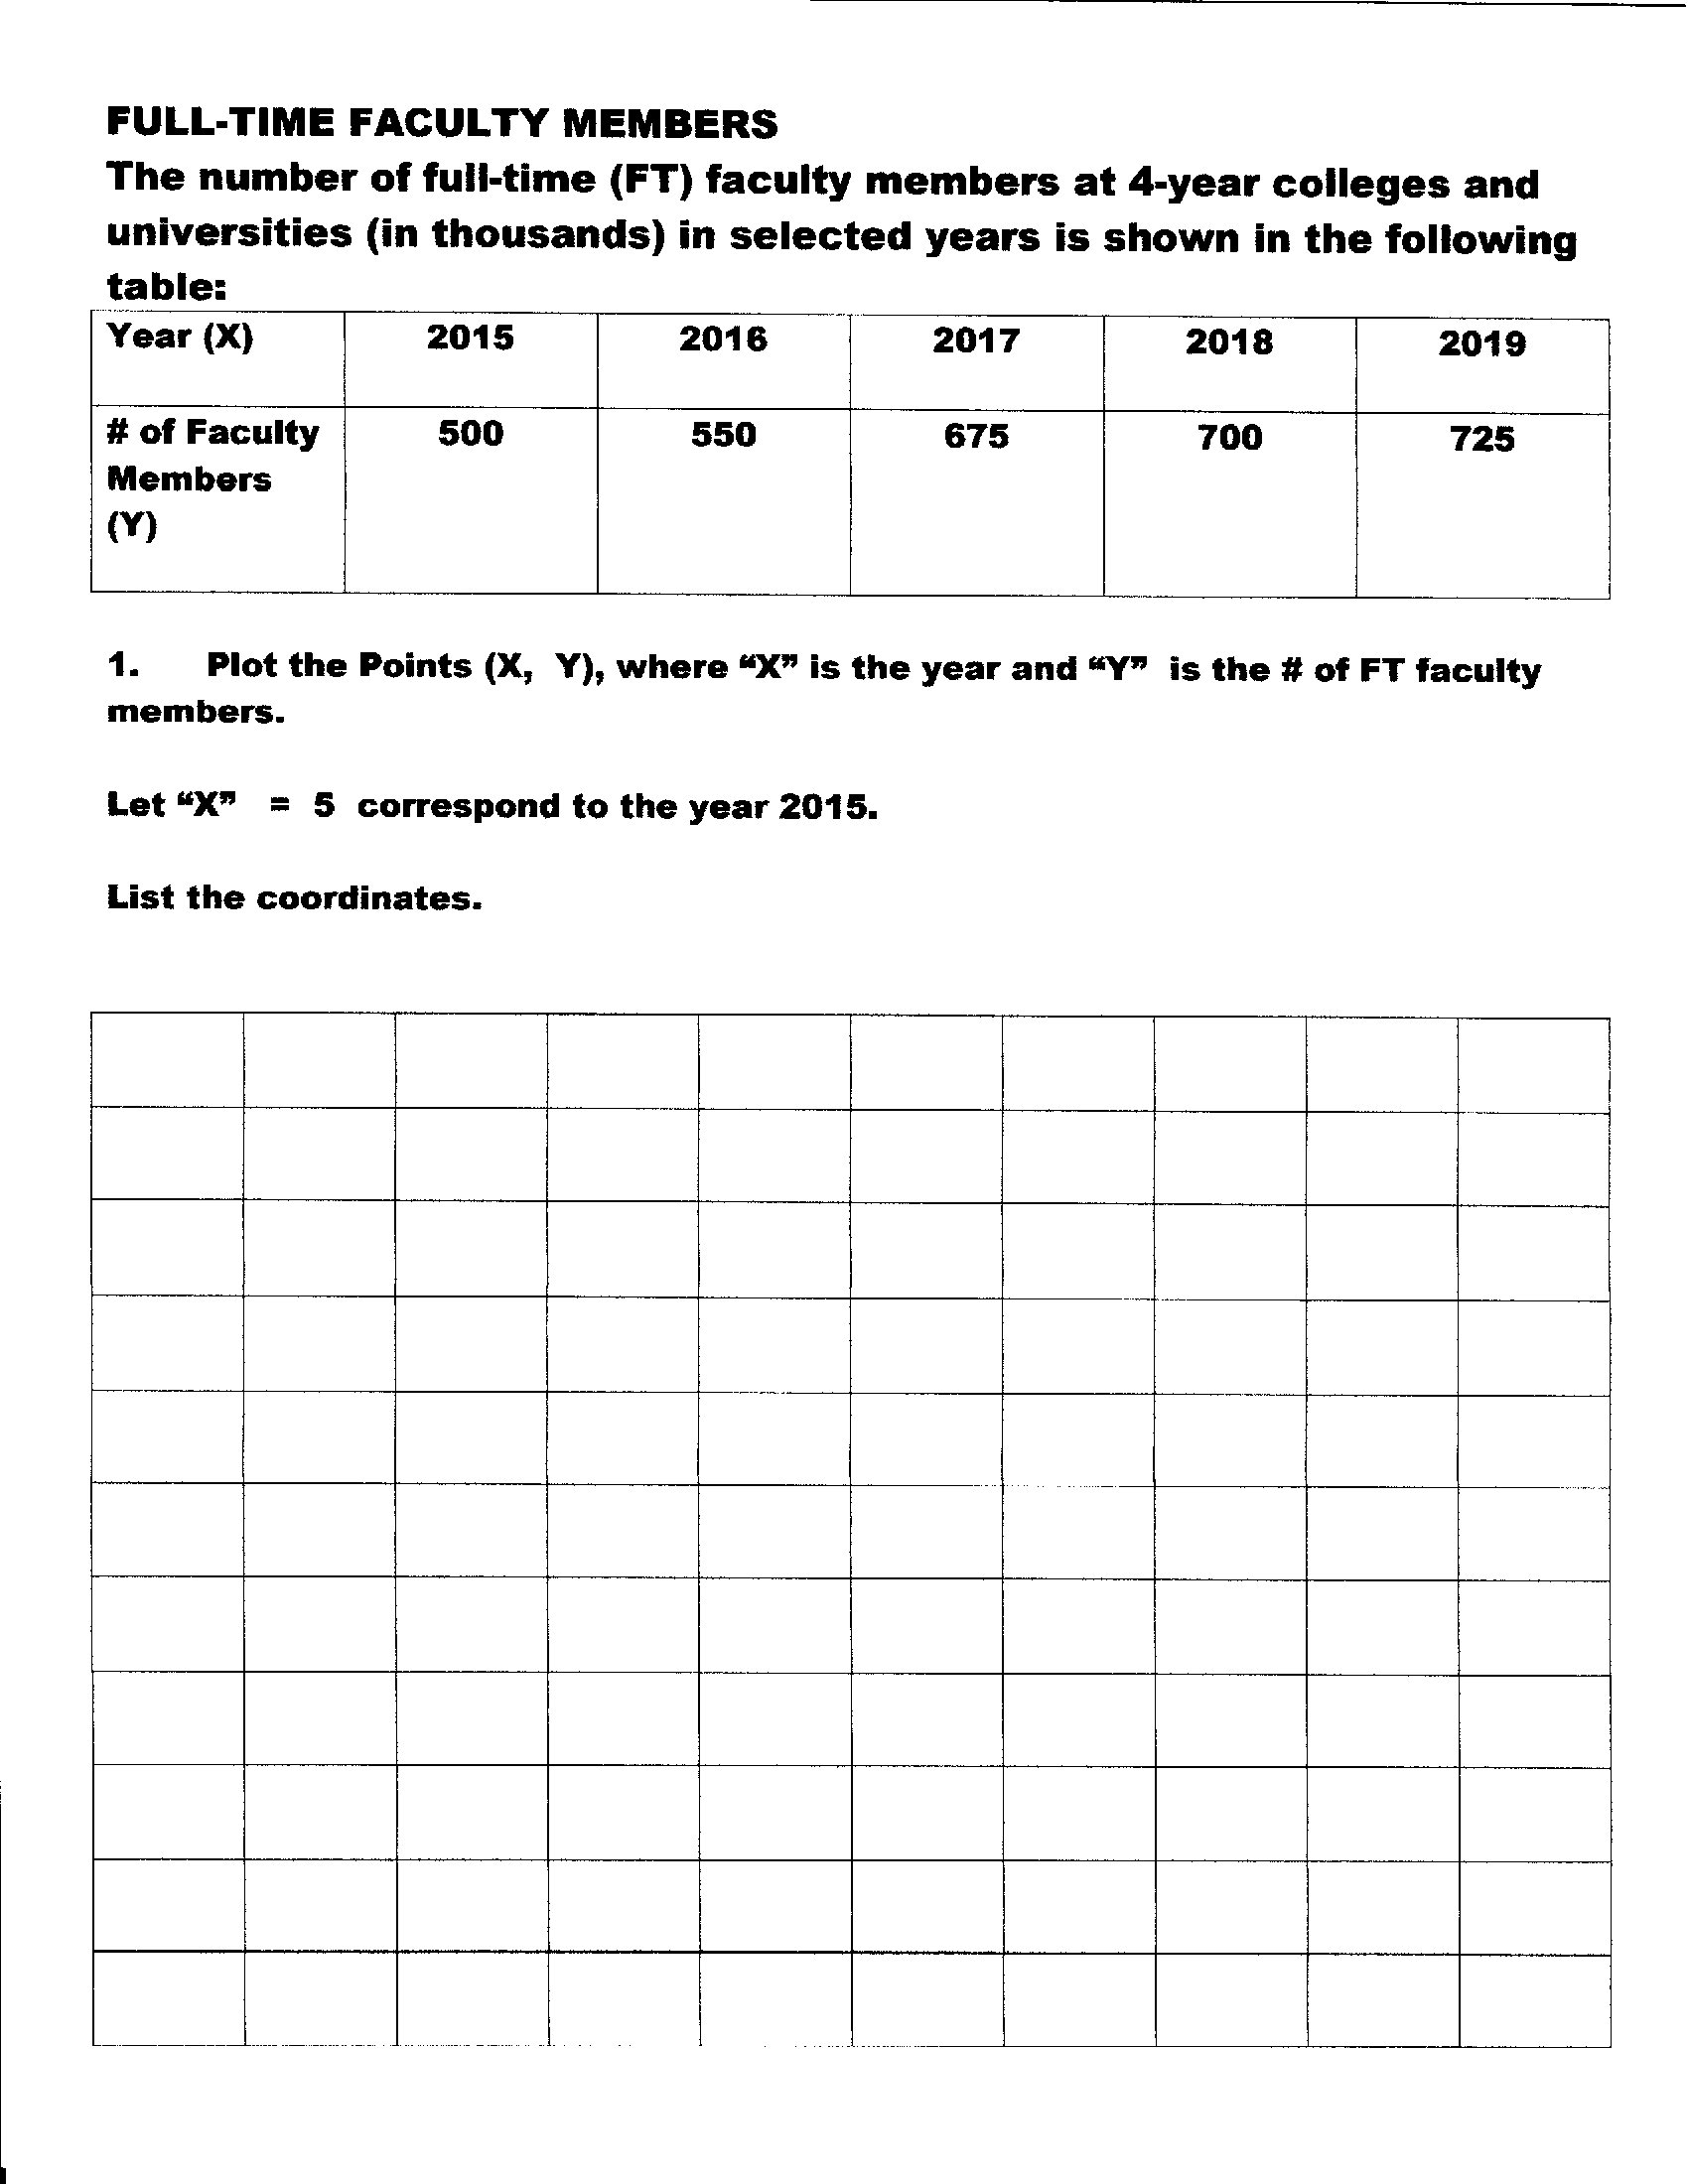
FULL-TIME FACULTY MEMBERS The number of full-time (FT) faculty members at 4-year colleges and universities (in thousands) in selected years is shown in the following table= a Year (X) 2016 2017 2018 2019 # of Faculty Members (Y) 550 675 700 725 1. Plot the Points (X, Y), where \"X\" is the year and \"Y\" is the # of FT faculty members. Let \"X\" = 5 correspond to the year 2015. List the coordinates. Use the data points (8, 700) and (6, 550) to find a line that models these data. a. Compute the slope of the line through (8, 700) and (6, 550). b. Using the point (8, 700) and the slope, nd the equation of the line. YY1 = uxx.) c. Plot the line on the same coordinate system. What do you notice
Step by Step Solution
There are 3 Steps involved in it

Get step-by-step solutions from verified subject matter experts