

Question: Can you make an excel equation to determine whether the stock is overvalued, fairly valued or undervalued based on the chart above? An analyst has
Can you make an excel equation to determine whether the stock is overvalued, fairly valued or undervalued based on the chart above?
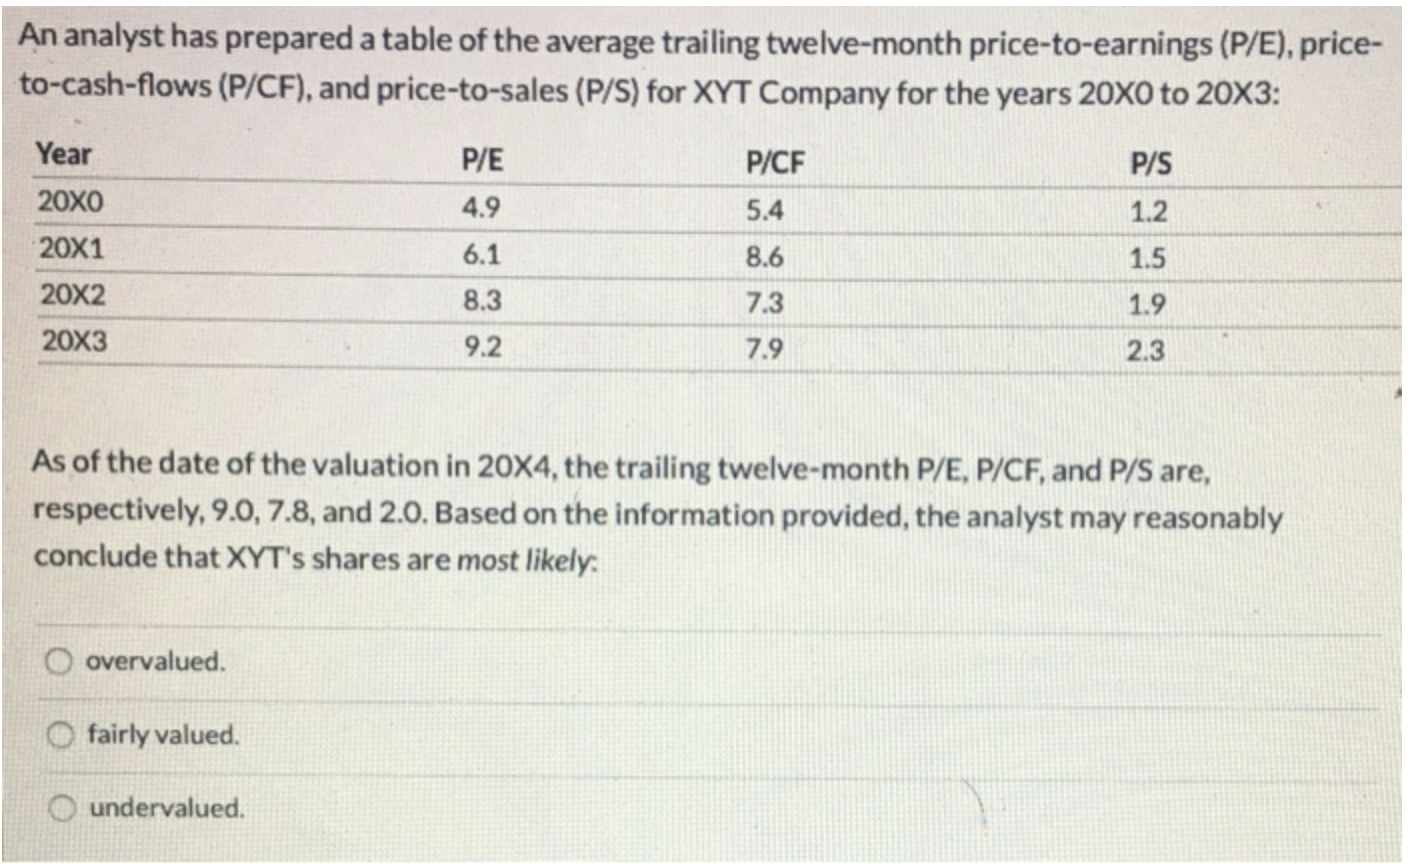
An analyst has prepared a table of the average trailing twelve-month price-to-earnings (P/E), price- to-cash-flows (P/CF), and price-to-sales (P/S) for XYT Company for the years 20X0 to 20X3: Year P/E P/CF P/S 20x0 4.9 5.4 1.2 20X1 6.1 8.6 1.5 20x2 8.3 7.3 1.9 20x3 9.2 7.9 2.3 As of the date of the valuation in 20X4, the trailing twelve-month P/E, P/CF, and P/S are, respectively, 9.0, 7.8, and 2.0. Based on the information provided, the analyst may reasonably conclude that XYT's shares are most likely: O overvalued. O fairly valued undervalued
Step by Step Solution
There are 3 Steps involved in it

Get step-by-step solutions from verified subject matter experts