

Question: Can you make code for this? (Matlab) 1. Plot the function z = sin(Vz4y ) for z = [-5 : .5 : 5] and y
Can you make code for this? (Matlab)
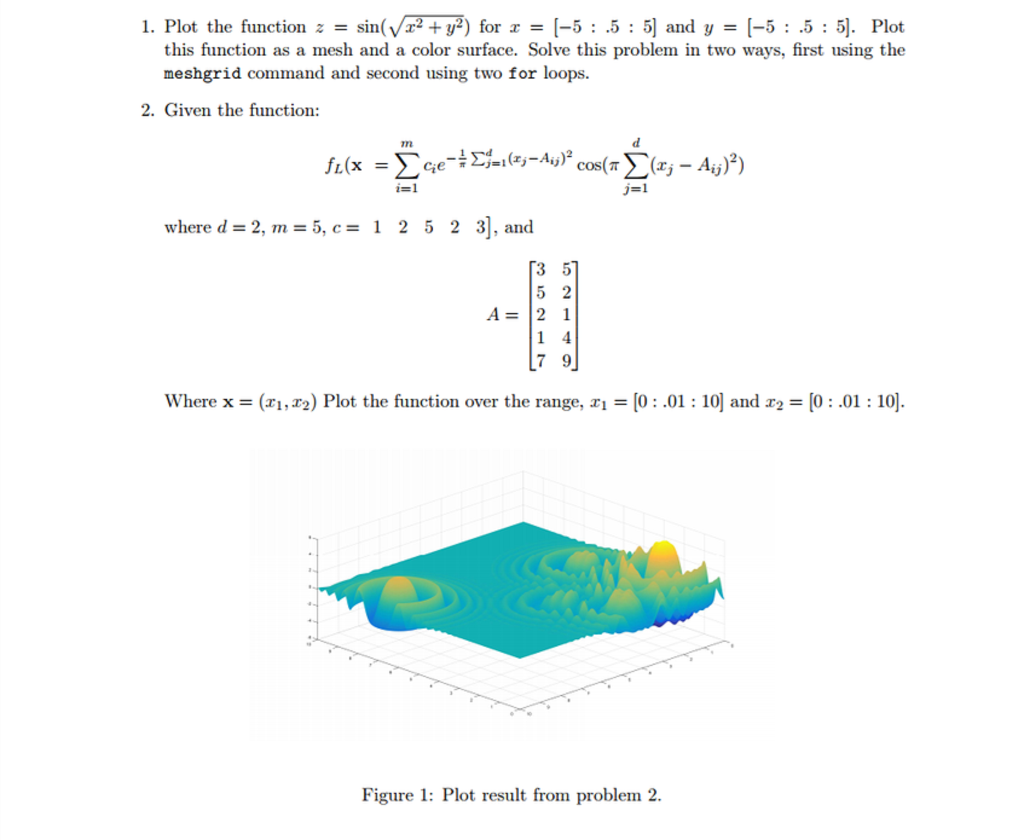
1. Plot the function z = sin(Vz4y ) for z = [-5 : .5 : 5] and y = [-5 : .5 : 5]. Plot this function as a mesh and a color surface. Solve this problem in two ways, first using the meshgrid command and second using two for loops 2. Given the function: L(X = 3-1 where d = 2, m = 5, e= 1 2 5 2 3], and T3 5 7 9J where x (zi,T2) Plot the function over the range, x,-[0 : .01 : 10] and z,-0: .01 : 10). Figure 1: Plot result from problem 2
Step by Step Solution
There are 3 Steps involved in it
1 Expert Approved Answer
Step: 1 Unlock

Question Has Been Solved by an Expert!
Get step-by-step solutions from verified subject matter experts
Step: 2 Unlock
Step: 3 Unlock