

Question: MATLAB, please show code 1. Plot the function y(x) for -2sx $ 4 using two methods, on the same set of axes y 3.5 5-05*
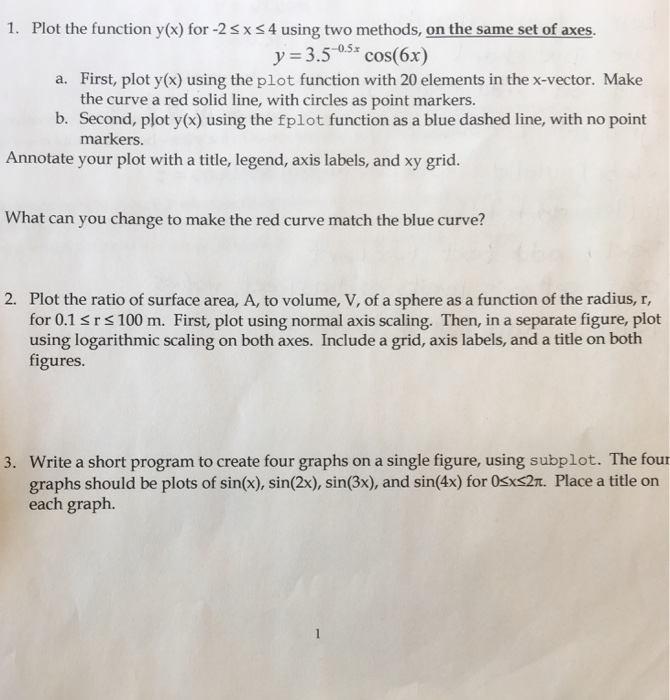
1. Plot the function y(x) for -2sx $ 4 using two methods, on the same set of axes y 3.5 5-05* cos(6x) First, plot y(x) using the plot function with 20 elements in the x-vector. Make the curve a red solid line, with circles as point markers. a. b. Second, plot y(x) using the fplot function as a blue dashed line, with no point markers Annotate your plot with a title, legend, axis labels, and xy grid. What can you change to make the red curve match the blue curve? 2. Plot the ratio of surface area, A, to volume, V, of a sphere as a function of the radius, T for 0.1 s rs 100 m. First, plot using normal axis scaling. Then, in a separate figure, plot using logarithmic scaling on both axes. Include a grid, axis labels, and a title on both figures. 3. Write a short program to create four graphs on a single figure, using subplot. The four graphs should be plots of sin(), sin(2x), sin(3x), and sin(x) for Osxs2t. Place a title on each graph
Step by Step Solution
There are 3 Steps involved in it

Get step-by-step solutions from verified subject matter experts