

Question: can you please answer it ASAP Consider the piston ring data shown in Table 6.3. Assume that the specifications on this component are 74.0000.05mm. a.
can you please answer it ASAP 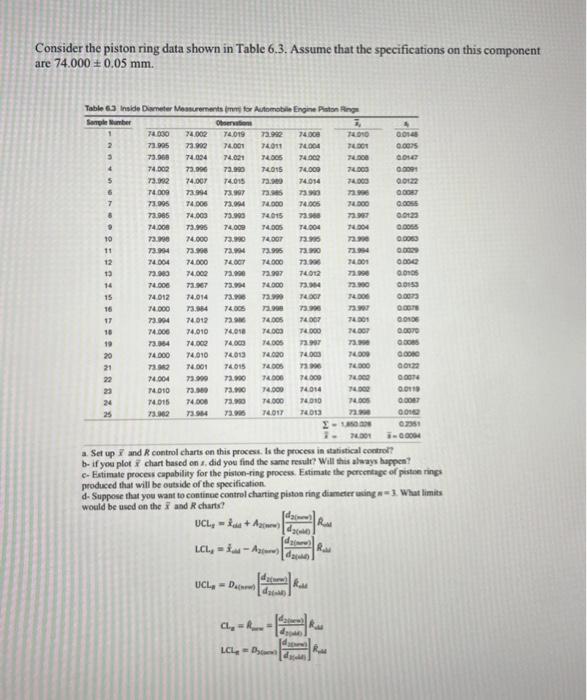
Consider the piston ring data shown in Table 6.3. Assume that the specifications on this component are 74.0000.05mm. a. Set up I and R control charts on this proces. Is the process in statistical control? b. if you plot x~ chart hased on x, did you find the same result? Whill this aleays happen? c- Estimate process capability for the piston-ring process. Estimate the perecntage of pistine rings produced that will be outride of the specification. d. Suppose that you want to contince control charting pisos ring diameter using w=3. What limis would be used en the x and R charts
Step by Step Solution
There are 3 Steps involved in it
1 Expert Approved Answer
Step: 1 Unlock

Question Has Been Solved by an Expert!
Get step-by-step solutions from verified subject matter experts
Step: 2 Unlock
Step: 3 Unlock