

Question: Consider the piston ring data shown in Table 6.3. Assume that the specifications on this component are 74.0000.05mm. a. Set up x and R control

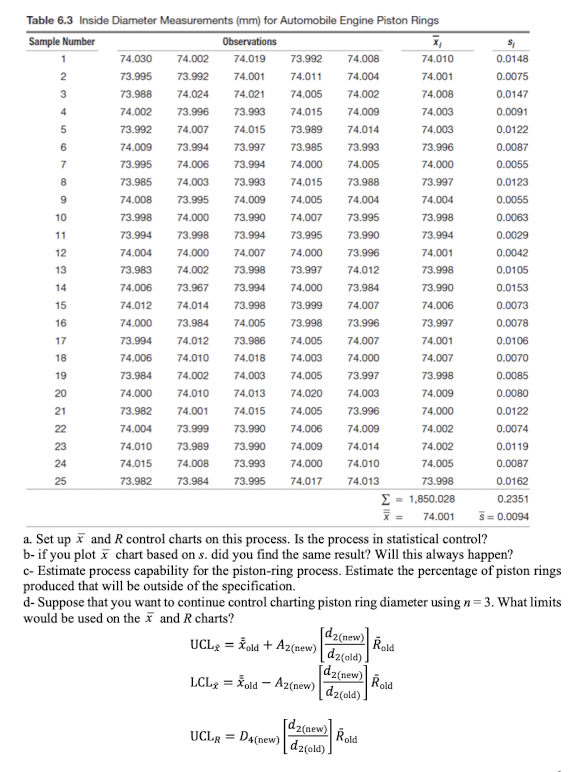
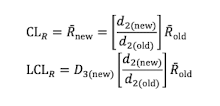
Consider the piston ring data shown in Table 6.3. Assume that the specifications on this component are 74.0000.05mm. a. Set up x and R control charts on this process. Is the process in statistical control? b- if you plot x chart based on s. did you find the same result? Will this always happen? c- Estimate process capability for the piston-ring process. Estimate the percentage of piston rings produced that will be outside of the specification. d- Suppose that you want to continue control charting piston ring diameter using n=3. What limits would be used on the x and R charts? UCLx^=xold+A2(new)[d2(old)d2(new)]RoldLCLx=xoldA2(new)[d2(old)d2(new))]RoldUCLR=D4(new)[d2(old)d2(new)]Rold CLR=Rnew=[d2(old)d2(new)]RoldLCLR=D3(new)[d2(old)d2(new)]Rold
Step by Step Solution
There are 3 Steps involved in it

Get step-by-step solutions from verified subject matter experts