

Question: can you please build differential equations in simulink? STATEMENT A boarding school is a relatively closed community in which all students live on campus, teachers
can you please build differential equations in simulink?
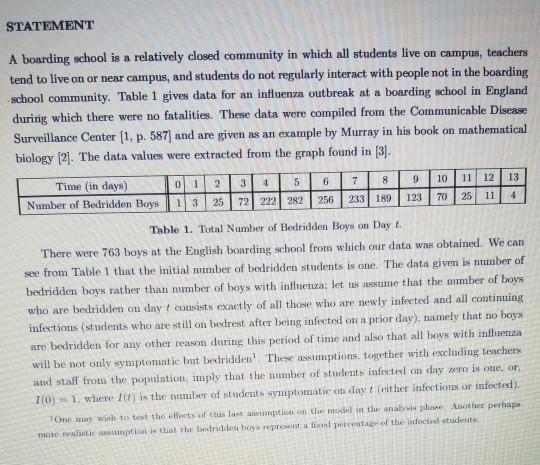
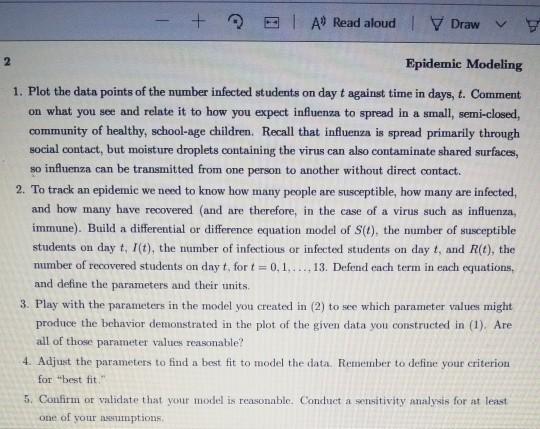
STATEMENT A boarding school is a relatively closed community in which all students live on campus, teachers tend to live on or near campus, and students do not regularly interact with people not in the boarding school community. Table 1 gives data for an influenza outbreak at a boarding school in England during which there were no fatalities. These data were compiled from the Communicable Disease Surveillance Center (1, p. 587) and are given as an example by Murray in his book on mathematical biology [2]. The data values were extracted from the graph found in (3) 0 7 1 10 8 9 13 Time (in days) Number of Bedridden Boys 2 3 4 5 25 72 222 282 11 | 12 25 11 256 233 189 123 70 4 13 Table 1. Total Number of Bedridden Boys on Day L. There were 763 boys at the English boarding school from which our data was obtained. We can see from Table 1 that the initial number of bedridden students is one. The data given is number of bedridden boys rather than number of boys with influenza; let tas nestume that the number of boys who are bedridden on day t consists exactly of all those who are newly infected and all continuing infections (students who are still on bedrest after being infected on a prior day), namely that no boys are bedridden for any other reason during this period of time and also that all boys with influenza will be not only symptomatic but bedridden' These assumptions, together with excluding teachers and staff from the population, imply that the number of students infected on day ma is one, or 7(0) = 1, where is the number of students symptomatic an day trither infections or infected). TO may wish to test the effects of the last sumption on the model in the analysipline Another perhaps more at that the bedridden boys representa el percent of the infected student E A Read aloud Draw 2 Epidemic Modeling 1. Plot the data points of the number infected students on day t against time in days, t. Comment on what you see and relate it to how you expect influenza to spread in a small, semi-closed, community of healthy, school-age children. Recall that influenza is spread primarily through social contact, but moisture droplets containing the virus can also contaminate shared surfaces, so influenza can be transmitted from one person to another without direct contact. 2. To track an epidemic we need to know how many people are susceptible, how many are infected, and how many have recovered and are therefore, in the case of a virus such as influenza, immune). Build a differential or difference equation model of S(e), the number of susceptibl students on dayt, (t), the number of infectious or infected students on day t, and R(6), the number of recovered students on day t, for t = 0.1...... 13. Defend each term in each equations, and define the parameters and their units. 3. Play with the parameters in the model you created in (2) to see which parameter values might produce the behavior demonstrated in the plot of the given data you constructed in (1). Are all of those parameter values reasonable? 4. Adjust the parameters to find a best fit to model the data. Remember to define your criterion for best fit 5. Confirm or validate that your model is reasonable. Conduct a sensitivity analysis for at least one of your numptions STATEMENT A boarding school is a relatively closed community in which all students live on campus, teachers tend to live on or near campus, and students do not regularly interact with people not in the boarding school community. Table 1 gives data for an influenza outbreak at a boarding school in England during which there were no fatalities. These data were compiled from the Communicable Disease Surveillance Center (1, p. 587) and are given as an example by Murray in his book on mathematical biology [2]. The data values were extracted from the graph found in (3) 0 7 1 10 8 9 13 Time (in days) Number of Bedridden Boys 2 3 4 5 25 72 222 282 11 | 12 25 11 256 233 189 123 70 4 13 Table 1. Total Number of Bedridden Boys on Day L. There were 763 boys at the English boarding school from which our data was obtained. We can see from Table 1 that the initial number of bedridden students is one. The data given is number of bedridden boys rather than number of boys with influenza; let tas nestume that the number of boys who are bedridden on day t consists exactly of all those who are newly infected and all continuing infections (students who are still on bedrest after being infected on a prior day), namely that no boys are bedridden for any other reason during this period of time and also that all boys with influenza will be not only symptomatic but bedridden' These assumptions, together with excluding teachers and staff from the population, imply that the number of students infected on day ma is one, or 7(0) = 1, where is the number of students symptomatic an day trither infections or infected). TO may wish to test the effects of the last sumption on the model in the analysipline Another perhaps more at that the bedridden boys representa el percent of the infected student E A Read aloud Draw 2 Epidemic Modeling 1. Plot the data points of the number infected students on day t against time in days, t. Comment on what you see and relate it to how you expect influenza to spread in a small, semi-closed, community of healthy, school-age children. Recall that influenza is spread primarily through social contact, but moisture droplets containing the virus can also contaminate shared surfaces, so influenza can be transmitted from one person to another without direct contact. 2. To track an epidemic we need to know how many people are susceptible, how many are infected, and how many have recovered and are therefore, in the case of a virus such as influenza, immune). Build a differential or difference equation model of S(e), the number of susceptibl students on dayt, (t), the number of infectious or infected students on day t, and R(6), the number of recovered students on day t, for t = 0.1...... 13. Defend each term in each equations, and define the parameters and their units. 3. Play with the parameters in the model you created in (2) to see which parameter values might produce the behavior demonstrated in the plot of the given data you constructed in (1). Are all of those parameter values reasonable? 4. Adjust the parameters to find a best fit to model the data. Remember to define your criterion for best fit 5. Confirm or validate that your model is reasonable. Conduct a sensitivity analysis for at least one of your numptionsStep by Step Solution
There are 3 Steps involved in it
1 Expert Approved Answer
Step: 1 Unlock

Question Has Been Solved by an Expert!
Get step-by-step solutions from verified subject matter experts
Step: 2 Unlock
Step: 3 Unlock