

Question: Can you please solve on excel and show the formulas? Thank you! Consider the following coupon bond: with maturity of N years, annual $CPN coupon
Can you please solve on excel and show the formulas? Thank you!
Consider the following coupon bond:
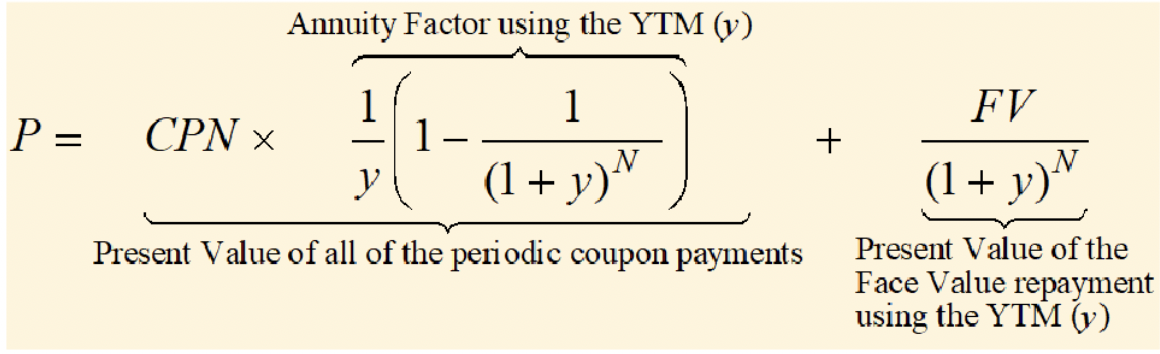
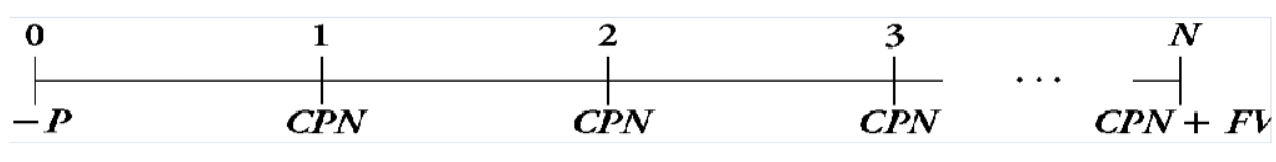 with maturity of N years, annual $CPN coupon payments, a face value of $FV, and a yield-to-maturity of y. Using the annuity formula, the price of this bond, P, is:
Market rate: 4%, Nper: 10, PMT: 50, FV: 1000, PV: $1,081.11
Create a column for yield-to-maturity (y) ranging from 0% to 30%. Calculate the bond price for each of the yield values in a new column. Graph bond prices vs. ys. Explain the pattern you observe.
As we saw in Chapter 2, interest rate risk is one of the key risks for fixed income securities. What is the graphical representation for price sensitivity (a.k.a duration) to changes in interest rate risk, y? [Hint: Pick any y level and using Excel drawing tools draw the tangency line to the curve to find the slope of the curve, dP/dy.]
P=PresentValueofalloftheperiodiccouponpaymentsCPNy1(1(1+y)N1)AnnuityFactorusingtheYTM(y)+PresentValueoftheFaceValuerepaymentusingtheYTM(y)(1+y)NFV
Step by Step Solution
There are 3 Steps involved in it

Get step-by-step solutions from verified subject matter experts