

Question: can you plot the graphs mentioned in the image using the following data Table 5. Summary of the sample calculations before equilibrium. Run C A
can you plot the graphs mentioned in the image using the following data
Table 5. Summary of the sample calculations before equilibrium.
| Run | CA (gmol / L) | XA | K(L.gmol/min) | -ra (gmol/Lmin) |
| 1st | 0.008 | 0.84 | 1.180604357 | 0.002951511 |
| 2nd | 0.00755 | 0.849 | 1.509333333 | 0.003773333 |
| 3rd | 0.00745 | 0.851 | 2.387096774 | 0.005967742 |
Table 6. Summary of sample calculations after 2 hours (at equilibrium).
| Run | CA (gmol / L) | XA | K(L.gmol/min) | -ra (gmol/Lmin) |
| 1st | 0.078 | 0.56 | 0.787069571 | 0.001967674 |
| 2nd | 0.073 | 0.46 | 0.817777778 | 0.002044444 |
| 3rd | 0.07 | 0.4 | 1.122019635 | 0.002805049 |
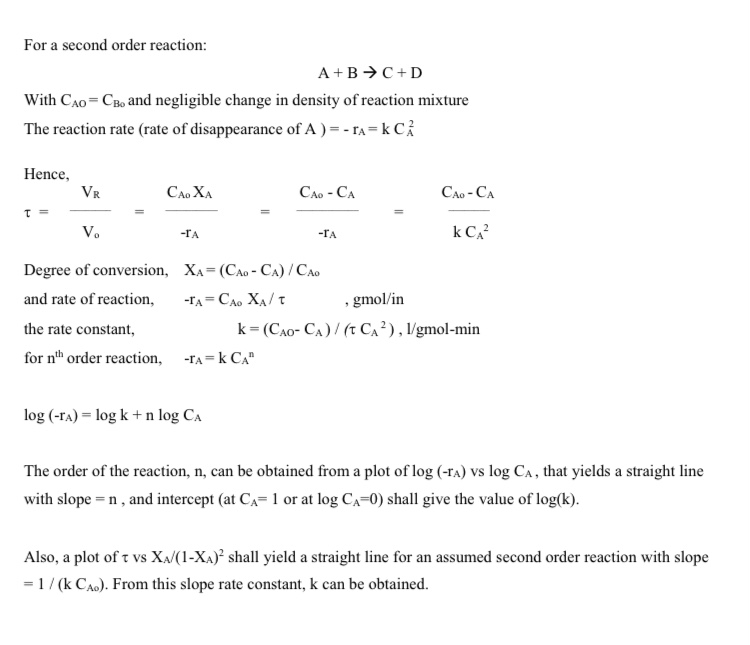
For a second order reaction: A+BC+D With CAO=CBo and negligible change in density of reaction mixture The reaction rate (rate of disappearance of A ) =rA=kCA2 Hence, =VoVR=rACA0XA=kCA2CA0CArA Degree of conversion, XA=(CA0CA)/CA0 and rate of reaction, rA=CA0XA/,gmol/in the rate constant, k=(CAOCA)/(CA2),1/ gmol-min for nth order reaction, rA=kCAn log(rA)=logk+nlogCA The order of the reaction, n, can be obtained from a plot of log(rA) vs logCA, that yields a straight line with slope =n, and intercept ( at CA=1 or at logCA=0) shall give the value of log(k). Also, a plot of vs XA/(1XA)2 shall yield a straight line for an assumed second order reaction with slope =1/(kCA0). From this slope rate constant, k can be obtained
Step by Step Solution
There are 3 Steps involved in it

Get step-by-step solutions from verified subject matter experts