

Question: Can you show all steps on MATLAB Construct the following simulation block diagram 1 . Set ( boldsymbol { k } =
Can you show all steps on MATLAB
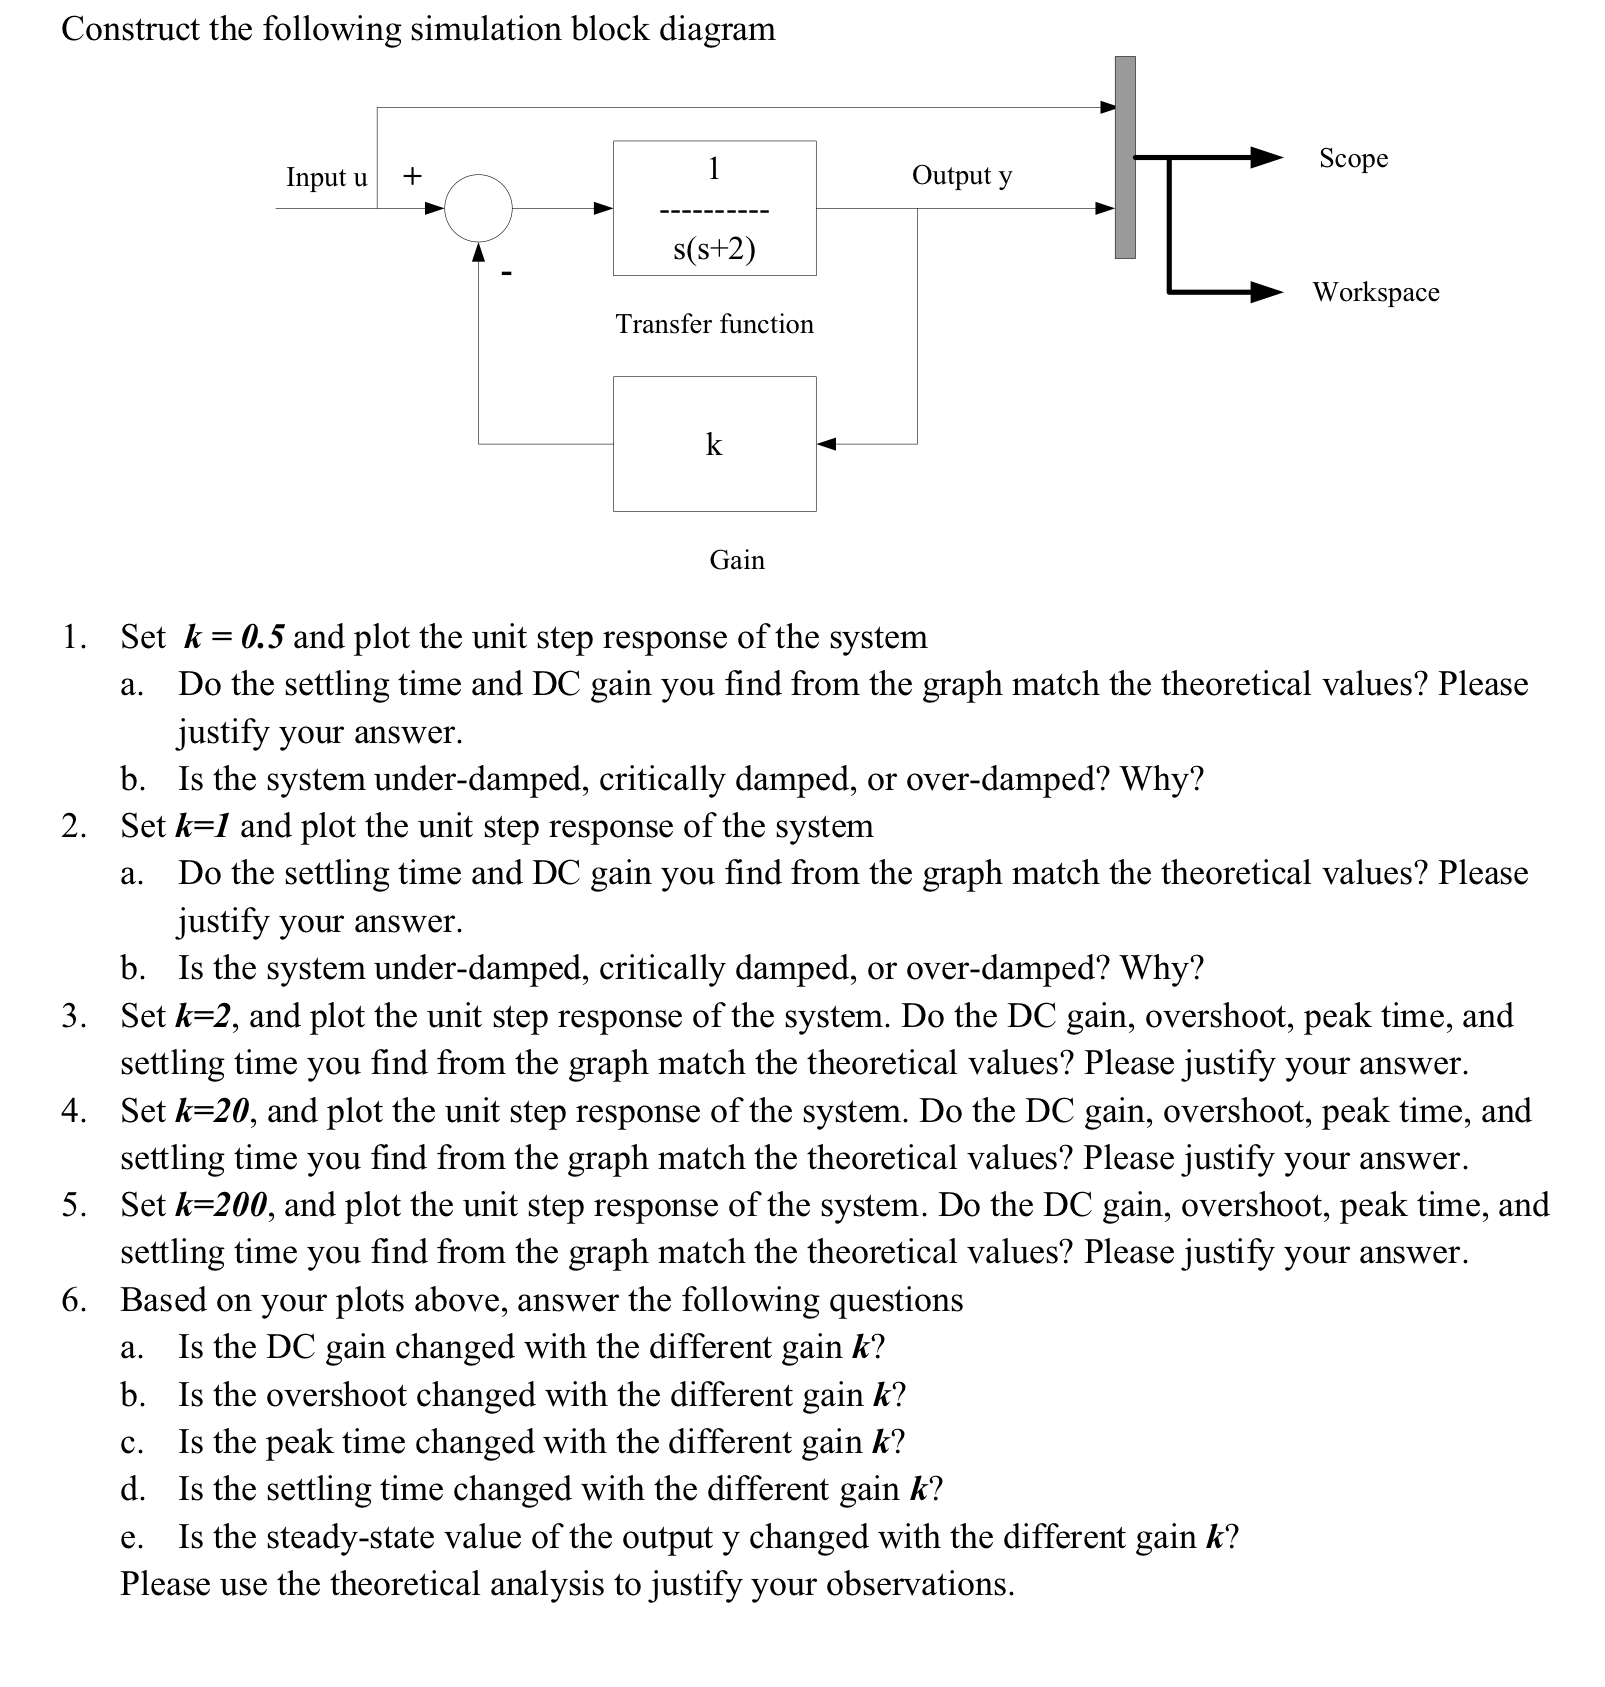
Construct the following simulation block diagram
Set boldsymbolkmathbf and plot the unit step response of the system
a Do the settling time and DC gain you find from the graph match the theoretical values? Please justify your answer.
b Is the system underdamped, critically damped, or overdamped? Why?
Set boldsymbolkboldsymbol and plot the unit step response of the system
a Do the settling time and DC gain you find from the graph match the theoretical values? Please justify your answer.
b Is the system underdamped, critically damped, or overdamped? Why?
Set boldsymbolkmathbf and plot the unit step response of the system. Do the DC gain, overshoot, peak time, and settling time you find from the graph match the theoretical values? Please justify your answer.
Set boldsymbolkmathbf and plot the unit step response of the system. Do the DC gain, overshoot, peak time, and settling time you find from the graph match the theoretical values? Please justify your answer.
Set boldsymbolkmathbf and plot the unit step response of the system. Do the DC gain, overshoot, peak time, and settling time you find from the graph match the theoretical values? Please justify your answer.
Based on your plots above, answer the following questions
a Is the DC gain changed with the different gain boldsymbolk
b Is the overshoot changed with the different gain boldsymbolk
c Is the peak time changed with the different gain boldsymbolk
d Is the settling time changed with the different gain boldsymbolk
e Is the steadystate value of the output y changed with the different gain boldsymbolk
Please use the theoretical analysis to justify your observations.
Step by Step Solution
There are 3 Steps involved in it
1 Expert Approved Answer
Step: 1 Unlock

Question Has Been Solved by an Expert!
Get step-by-step solutions from verified subject matter experts
Step: 2 Unlock
Step: 3 Unlock